
Viz World User Guide
Version 17.0 | Published January 24, 2018 ©
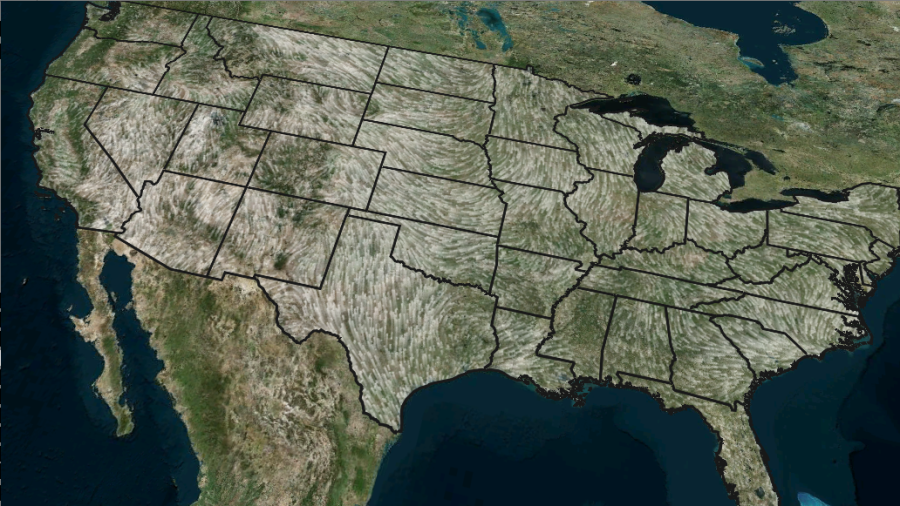
WindFlows
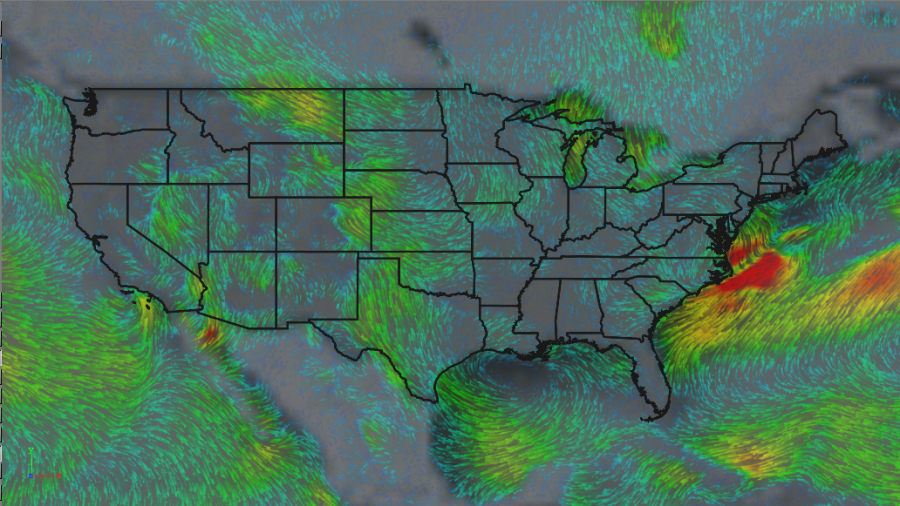
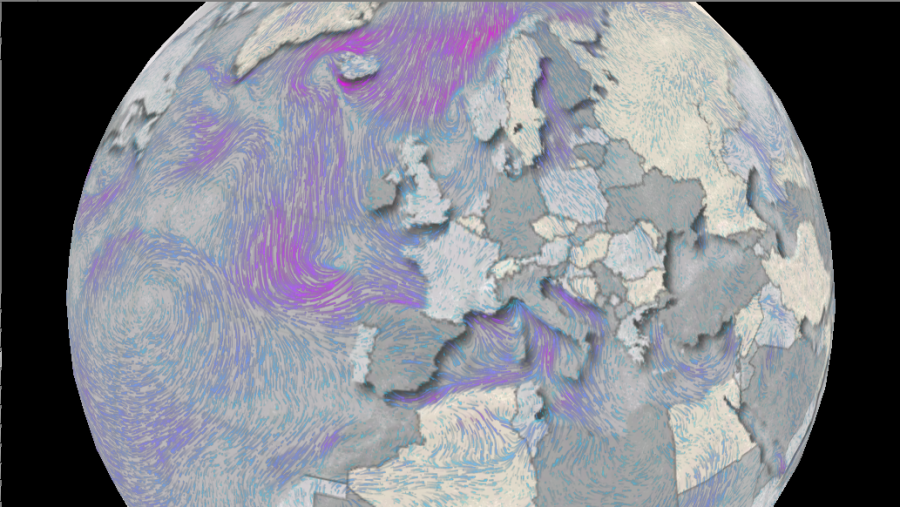
The WindFlows plug-in visualizes geo-located winds by representing it as running flows of various length and colors on top of a map. The flow direction corresponds to the wind direction. The plug-in can load multiple time frames of wind velocities and directions, and produce a smooth animation over time.
This section contains the following information:
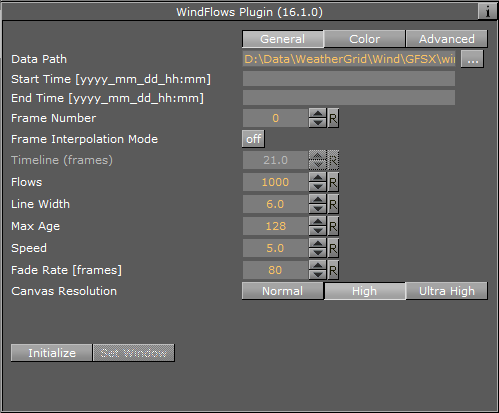
General Tab
-
Data Path: Specify data files or relevant data (comes in u and v components). This should be a weather grid model data of type Wind. An "hours" folder of windU or windV component should be specified as input.
Example: W:\DemoData\WindSpeed\EC025\windU\contourdata\hours -
Start Time / End Time: If time frame is specified, only data relevant for that time frame is loaded.
-
Frame Number: Choose desired time frame of data.
-
Frame Interpolation Mode: Enable to make the plug-in load all available frames of animation, in order to produce a smooth animation between time frames.
The Data Buffer Size [mb] parameter under the Advanced options limits the number of time frames that is being loaded to animation according to desired size.
-
Timeline (frames): While in interpolation mode this parameter controls time progress between frames. Only this parameter and not 'Frame Number' should be animated.
-
Flows: Number of flows representing wind. Flows are randomly distributed across the 'canvas'.
-
Line Width: Defines width of strokes. Width is specified in pixels of canvas, changing canvas size cause flows to look as if their width was changed.
-
Max Age: Defines maximum age in frames of the flows. The age (length) of each stroke is a random quantity, however, flows presented in area of strong winds move faster and those appear longer.
-
Speed: Controls general speed level of flows, although faster winds always result in faster flows.
-
Fade Rate [frames]: How many frames it takes to completely fade out the stroke.
-
Canvas Resolution: Flows are rendered to some canvas and then this canvas is applied to map like a texture. This parameter lets you change the size of the canvas. Large canvases are useful when small zoom-ins are required without losing the resolution. Flows widths, however, are affected by canvas size.
-
Normal canvas size corresponds to HD resolution (1920X1080).
-
High corresponds to 4K (3840x2160).
-
Ultra High corresponds to 7680x4320.
When using Dynamic mode, there is no reason to go beyond Normal canvas size.
-
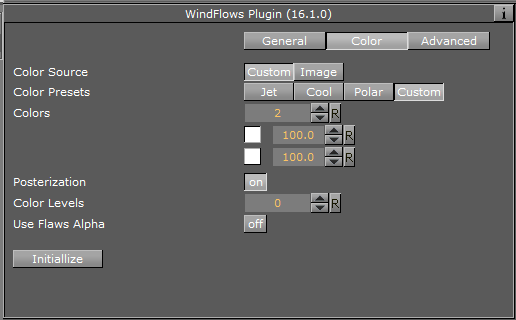
Color Tab
-
Color Source: Defines whether color preset will be taken from image or 'manual' preset.
-
Color Presets: Predefines color presets to start with. Every change will change the position to custom.
-
Colors: Defines number of colors to be used in color-map, as well as their values.
-
Color Image: Alternatively, you can use and image to define the color map. Image should be dragged to this control.
An example of an image defining color map:
-
Posterization: Enables to split continuous color map to a desired number of discreet colors.
-
Color Levels: Defines number of desired levels for posterization.
-
Use Flaws Alpha: When enabled, wind strength effects transparency of the flow.
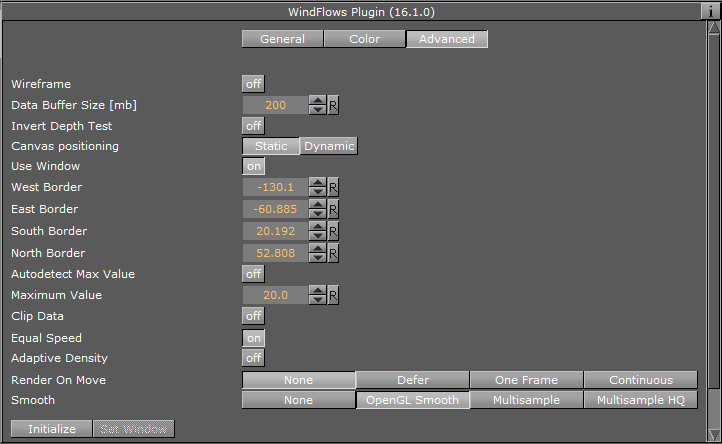
Advanced Tab
-
Wireframe: Display wireframe of the canvas geometry (may be useful for globe geography).
-
Data Buffer Size [mb]: Defines limit for the amount of data to be loaded to the plugin, used to limit number of frames in animation.
-
Invert Depth Test: Use to mask desired area and show winds only above that area. In order to do it a masking image should be put on top of wind flows and this option enabled. See example of the result in Appendix B.
-
Canvas Positioning: Flows are actually rendered to canvas, and then this canvas is placed on top of geo geometry. This parameter defines canvas coverage behavior. In "Dynamic" mode canvas is of the size of the visible geographic area which is calculated per frame. In static mode it covers basemap/data range and stays in place. As a result, if you zoom-in in static mode the resolution of flows will deteriorate. Use Window – Used to limit manually the visualization area to a specific geographic region defined by west/east/north/south borders. Enabled only in static mode.
-
Autodetect Max Value: When enabled, detects maximum value of loaded data and normalizes the visualization accordingly. Maximum Value – when autodetect is 'off' enables to choose manually the maximum value for normalization. All data larger than maximum defined value will obtain maximum value for visualization (maximum alpha and color representing strongest wind)
-
Clip Data: Enables to discard flows larger or smaller of specified clipping values – Clip Bottom/Clip Top
-
Equal Speed: If enabled, wind strength will only effect flows color, and all flows will spread with equal speed.
-
Adaptive Density: If enabled, will reduce dynamically number of flows according to zoom level such that there will be less flows as you zoom-in.
-
Density Upper Bound/Density Lower Bound: Defines percentage of flows (out of the number defined in General tab) for the current visible geographic range (When value is set, the visible geo area at that moment is considered). Any zoom-in level below the one saved for the lower bound or zoom-out above the one saved for the upper bound will have lower/upper amount of flows correspondently. In between, the number will be interpolated.
-
Render On Move: Defines behavior of the rendering during movement in dynamic canvas positioning mode. Since it is problematic to move canvas with already rendered data dynamically, add new data and still look correct a number of behaviors were defined:
-
None – nothing is shown during movement,
-
Defer – previous canvas state is preserved until movement stops,
-
One Frame – only one frame of flows is rendered, canvas is being reset after each frame,
-
Continuous – nothing is done.
The last option will produce a spread-blur effect.
-
-
Smooth: – defines smoothing quality of the flows. Be careful with Multisample HQ as it can be very expensive performance-wise.
Appendix A - Showing winds on top of Color Heat Map
It is possible to show flows on top of Color heat-map representing wind strength. In order to do it IsoGrid plugin will be used to show heat-map and WindFlows will show flows on top of it. Some change is required in configuration of the fetch to produce another folder with wind data representing wind strength (instead of just one vector component). This folder will be called windS and it should be loaded to IsoGrid in order to show the heat map.
Open WD Administration Tool, go to Providers Info and add the following line for each provider:
<entry name="isoScriptOutput">contours.log & WindSpeed.py --dataset "PATH_TO_DATA_FOLDER" -R_MODEL_GEO_BOUNDS –I_MODEL_RESOLUTION</entry>
-
PATH_TO_DATA_FOLDER is a path to folder containing WindU and WindV folders.
-
MODEL_GEO_BOUNDS are the bounds found in config.ini file of each model under ‘Region’ section.
-
MODEL_RESOLUTION – resolution of data in degrees, also found in config.ini file.
Example of such a line for GFSX model (0.5 degrees resolution):
<entry name="isoScriptOutput">contours.log & WindSpeed.py --dataset "C:\Program Files (x86)\vizrt\vizWeather2\SharedData\FetchData\Wind\GFSX" -R-180.000000/180.000000/-90.000000/90.000000 -I0.5</entry>
As mentioned above, after adding this line fetch application should fetch three folders for wind data – WindU, WindV and WindS representing strength.
Appendix B - Example of masking to desired region
Mask image is created with the help of CWM client plugin. The image should correspond exactly to a georeference on which GeoChart is placed, so make sure the basemap region will be defined in CWM plugin (in a case when Atlas is used as georeference put it beneath the CWM to correspond exactly).
-
Go to CWM plugin defining the georeference and change the Texture Compression parameter to 'None'. You can find it under the 'Texture tab'.
-
Open Viz World Map Editor and select desired region.
-
Put 'MapLayersCtrl' plugin on a container with CWM (the georeference).
-
In Map LayersCtrl plugin switch Control to Enable and deselect all options except the 'Selected Regions' and press 'Refresh Map'.
-
Go to CWM client's Miscellaneous tab and press 'Freeze'.
-
Drag the result image from container to the image pool. You can now use it as a mask for the selected region. You can unfreeze the CWM, remove MapLayersCtrl and change back texture compression, but be careful not to change the size and range of georeference map.