Viz Artist User Guide
Version 3.14 | Published October 30, 2020 ©
Pie Values

Use the Pie Values plug-in with the Pie Slice plug-in to create and animate a pie chart of up to 20 slices.
Note: This plug-in is located in: Built Ins -> Container plug-ins -> Presenter
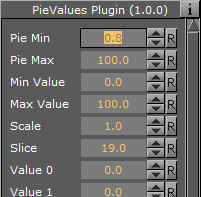
Pie Values Properties

-
Pie Min and Max: Sets the minimum and maximum values for the pie size and the range of the size.
-
Min and Max Value: Sets the range of the shown pie.
-
Scale: Sets the scale of the pie. Default is 1.
-
Slice: Sets the number of slices to be shown as part of the pie.
-
Value 0 - 19: Sets the slice value. Available number of slices is 20.
To Create a Pie Chart with the Pie Values Plug-in

-
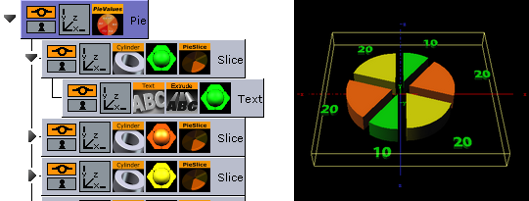
Add a group container to the scene tree, and name it Pie.
-
Open the transformation editor and set Rotation X to 45.0, and Scaling Y (single) to 0.2.
-
Add the Pie Values plug-in to the Pie container.
-
Open the Pie Values editor and set Slice to 6.0, and enter the following values in Value 0 to 5; 10.0, 20.0, 20.0, 10.0, 20.0, 20.0.
-
Add a Sub-Container to the Pie container and name it Slice.
-
Add the Cylinder geometry plug-in, material and PieSlice plug-in to the Slice container.
-
Open the PieSlice editor and set Offset to 10.0 and Text Offset to 80.0.
-
Add a Sub-Container to the Slice container and name it Text.
-
Open the transformation editor for the Text container and set Scaling (locked) to 0.2 and Rotation X to -90.0.
-
Add a font, material and the Extrude plug-in to the Text container.
-
Open the Extrude editor and set Extrusion Depth to 100.0.
-
Create and place a number of copies of the Slice container (e.g. 5) at the same level as the Slice container.
-
Change the colors of the pie slices to distinguish each slice.
See Also