Viz Vectar User Guide
Version 1.0 | Published May 07, 2020 ©
The Dashboard
The Dashboard groups important production features and system display controls in one convenient place for quick access and review. As well, the Dashboard serves to provide information on the current session, status updates and storage usage, along with timecode and the Macros and Options menu.
The Dashboard is home to several important displays, tools and controls. Prominently located at the very top of the Live Desktop, the Dashboard occupies the full width of the screen.
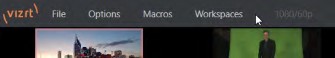
Initially, to avoid overwhelming users, the left end of the Dashboard shows the name of the current session. Moving the mouse pointer to the top of the screen reveals the set of menus.
![]()
The right half of the Dashboard contains additional features and tools that are more frequently accessed, for which reason they are displayed full-time. The various elements comprising the entire Dashboard are listed below (starting from the left):
-
File menu
-
Options menu
-
Macros menu – see 17
-
Workspaces menu – see 10
-
EXPORT button and Configuration (gear) – see 19
-
STREAM/ENCODE button and Configuration (gear) – see 18
-
RECORD/REPLAY buttons and Configuration (gear) – see 20
-
GRAB button and Configuration (gear) – see 20
-
Clock(s) and Configuration (gear) – see 7.5
-
Notification List
Some of these items are so important that they rate their own chapters. Others are detailed in various sections of this guide (cross references to the relevant sections of the manual are provided above). In this chapter, we’ll focus on those Dashboard features not discussed in greater depth elsewhere.