Viz Artist
Version 3.11.0 | Published January 22, 2018 ©
Data Fit
![]()
Data Fit listens for incoming data and modifies and redistributes it to another Shared Memory key.
Note: This plug-in is located in: Built Ins -> Container plug-ins -> VisualDataTools
This section contains information on the following topics:
Data Fit Properties

-
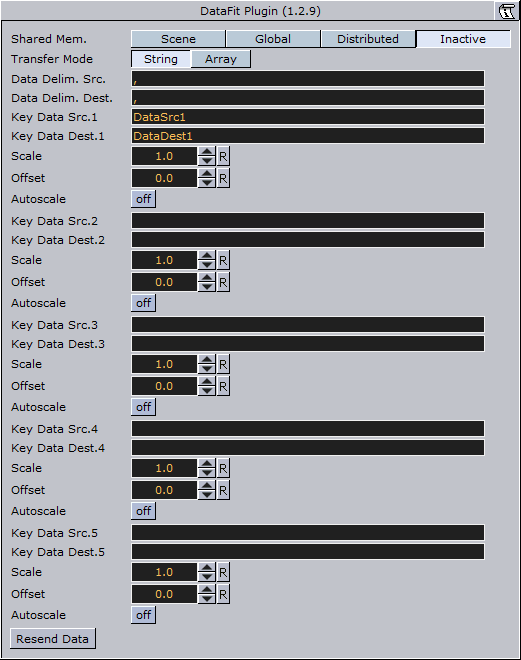
Shared Mem: Changes between Scene-, Global- and Distributed-Shared Memory. Use Inactive memory to not forward any values via Shared Memory.
-
Transfer Mode: Sets string- or array-based data transfer.
-
Data Delim. Src.: Defines the value separator sign(s) for all data sources.
-
Data Delim. Dest.: Defines the value separator sign(s) for all data destinations.
-
Key Data Src.1-5: Shared Mem. key name for input 1-5.
-
Key Data Dest.1-5: Shared Mem. key name for output 1-5.
-
Scale: Scales each incoming value by that factor.
-
Offset: Adds an Offset to each incoming value.
-
Autoscale: Activates automatic scaling mode. Now all data is scaled to a certain range defined by the following 2 parameters:
-
Start: Autoscale starting range.
-
Stop: Autoscale stopping range.
-
To Create a Scene with Data Fit

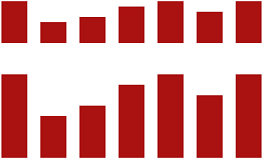
This procedure will feed two charts with data. One with the original and the other with the modified data from Data Fit.
-
Create a new container.
-
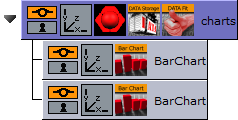
Drag and drop a Data Storage and a Data Fit plug-in into this container.
-
Drag and drop two Bar Chart plug-ins to become children of this container.
-
Open the plug-in editor of the first Bar Chart and set Shared Mem. to Scene and KeyData to “MyData”.
-
Do the same for the second Bar Chart but use “MyDataFit” as the key name.
-
Go to the DataFit plug-in and set its Shared Mem. type also to Scene
-
Set Key Data Src.1 to “MyData” and Key Data Dest.1 to “MyDataFit” > set Scale to 2.0.
-
The input Shared Mem key is specified with Key Data Src. and the output with Key Data Dest.
-
-
Now edit Data Storage for the input values: set Shared Mem. to Scene, Key Data1 to MyData and type in some example values for Data1: 80,40,50,70,80,60,80.
-
As soon as you start typing you see both charts building up with the different values from Data Fit.

-