Graphic Hub Administrator Guide
Version 3.6 | Published December 10, 2021 ©
Server Information
This page details the different methods to monitor a sever and its details.
Terminals Monitor
The Terminals monitor window provides an interface to view all on line terminals within the network. A terminal is the physical machine where the Graphic Hub Terminal application is running.
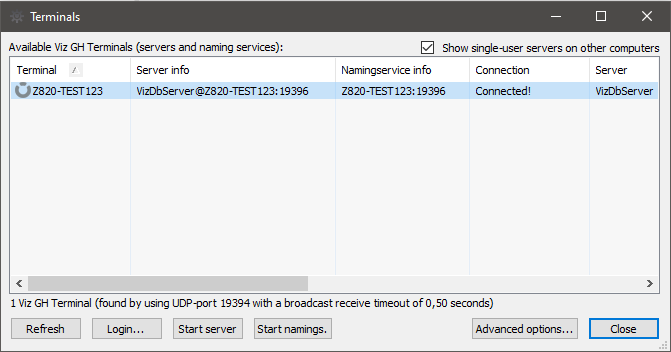
To Open the Terminals Window
-
Click Server > Terminals. The following columns are available:
-
Terminal: Shows the hostname of the physical machine where the Naming Service and/or server are installed. An icon represents the status of the server and Naming Service:
-
 Both the Naming Service and server are down.
 -
 The Naming Service is running, but the server is down.
 -
 The Naming Service is down, but the server is running.
 -
 Both the Naming Service and server are running.
-
-
Server info: Shows <Graphic Hub Server>@<Graphic Hub Naming Service>:<port the naming service is listening to>. A plus sign is added if you are logged on to the displayed server.
-
Naming Service info: Shows <Graphic Hub Naming Service>:<port the naming service is listening to>.
-
Connection: Shows if Graphic Hub Manager has a valid connection to the Graphic Hub Terminal.
-
Server: Shows the name of the server.
-
S. host: Shows the hostname of the physical machine where the server is installed.
-
S. port: Shows the port number the server communicates through.
-
S. up: Shows if the server is running. This is also indicated by the icon in the Terminal column.
-
S. in: Shows if you are logged into this server.
-
Naming Service: Shows the name of the Naming Service.
-
Ns. port: Shows the port number the Naming Service communicates through.
-
Ns. up: Shows if the Naming Service is running. This is also indicated by the icon in the Terminal column.
-
T. TCP-port: Shows the TCP port number, which can be used to start the server remotely from Graphic Hub Manager.
-
Terminal host network IP: Shows the IP address of the Terminal machine.
The following additional options are available:
-
Show single user servers on other computers: If selected, also shows servers/naming services in the network that are running in single-user mode (localhost).
-
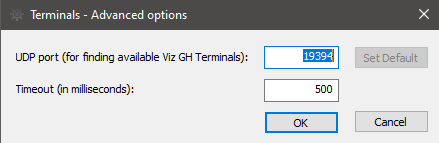
Advanced options: Open the Terminals Advanced Options window. Alternatively, press ALT + A.
-
UDP-Port: Set the UDP port where Graphic Hub Manager searches for Terminals (default: 19394).
Note: The terminals window can only be used with pre-web-based Graphic Hub Terminal (version 2.4.2 or older). The UDP port must be the same as the port that the Graphic Hub Terminal listens to. To check the port number, go to the Graphic Hub Terminal and check in Naming Service, which UDP port is set.
-
Timeout: Define how long the Graphic Hub Manager should listen for Terminals before timing out. The value is set in milliseconds.
-
-
Refresh: Updates the list. Alternatively, press ALT + R.
-
Login: To log in to a server, select the required server from the list, and then click the Login button. Alternatively, press ALT + L. This opens the Login window.
Note: It is not possible to log into a Graphic Hub installation by remote in single-user mode (localhost) from other physical machines.
-
Start server: If the server on a listed Terminal is not running, it is possible to start the server from this window. To do so, select the required server from the list, and click the Start Server button. Alternatively, press ALT + S.
-
Start Naming Service: If the Naming Service on a listed Terminal is not running, it is possible to start the Naming Service from this window. To do so, select the required server from the list, and click the Start Naming Service button. Alternatively, press ALT + N.
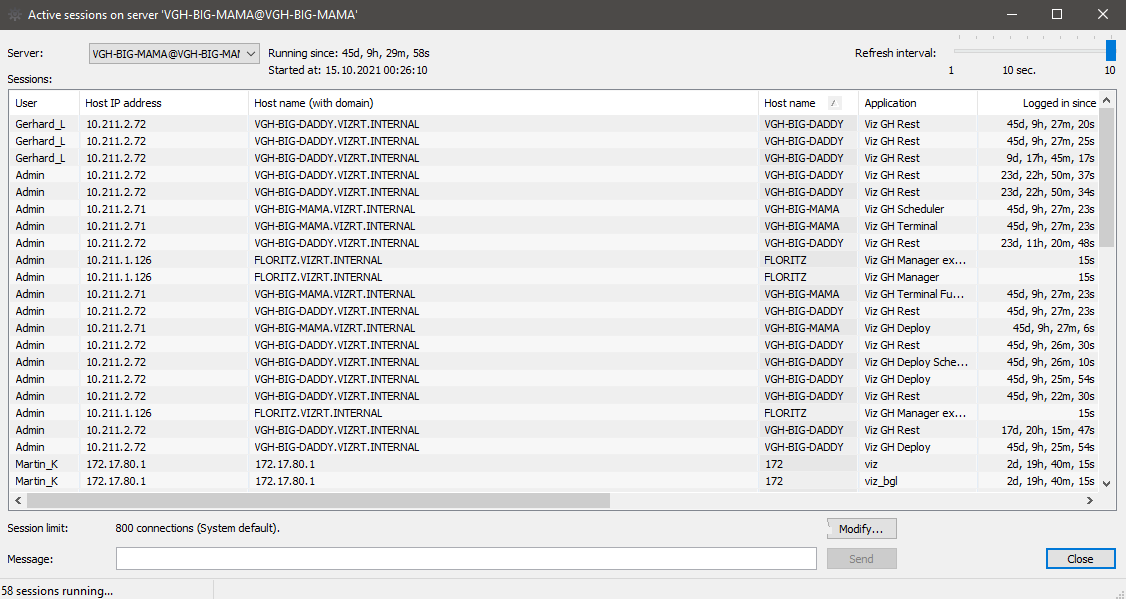
Active Sessions
From the Active Sessions window it is possible to monitor all logged in users and active sessions. When faced with network or connection problems, checking active sessions can provide important clues. Likewise, performance problems in general are easy to spot in the Active Sessions window, since you can see hosts and servers. In sum, for a good clue as to where to find connection, network and performance problems, look in the Active Sessions window.
To Open the Active Sessions Window
Click View > Active Sessions. The following options are available:
-
Server: If logged in to more than one server, select which server to monitor from the Server list.
-
Running since: Shows how long the selected server has been running, counting upwards in hours, minutes, and seconds.
Tip: The time relates to the system time on the server machine.
-
Started at: Shows the time and date when the server was started.
-
Refresh interval: Defines the interval for when information should be refreshed. It can be set to a value between one and ten seconds.
-
Message: To send a message to all clients that are logged in to the selected server, type a text in the Message box, and then click the Send button.
The Sessions list shows detailed information about the sessions that are active on the selected server. The following columns are available in the Sessions list:
-
User: Shows the name of the user that activated the session.
-
Host: Shows the host name of the machine that the session was started from.
-
Application: Describes the application and operation that the session belongs to.
-
Logged in since: Shows how long the user has been logged in to the server, counting upwards in hours, minutes, and seconds.
-
Last activity before: Shows the last time an operation was performed in the session.
-
No. of open files: Shows the number of files that are open in the system.
-
No. of locked files: Shows the number of files that are session locked.
-
Login time: Shows the time and date when the user logged in to the server.
-
Last activity: Shows the time and date of the last time an operation was performed in the session.
-
Priority: Set the priority of the sessions for the correct load balancing.
-
Session rights: Shows the access (read/write) rights for the session.
-
Notifications: Description used by the clients, for example to inform that files have been created.
Monitor Servers
From the Monitor servers window it is possible to view and analyze all servers that are currently logged in to.
To Open the Monitor Servers Window
-
Click Tools > Monitor Servers. The left part of the Monitor Servers window lists all available servers.
The right part of the window shows details about one or more selected servers. If all the available servers are working within the required parameters, this overview is hidden. If one or more servers are in warning state, the overview for these servers open automatically.
To View Server Details
-
Double-click the server in the Overview panel or right-click the server, and select Open Overview.
-
Select Open All Overviews to show details of all available servers.
Overview
The Overview frame shows a quick overview of all the parameters. A green light next to the parameter indicates that all systems are normal. A yellow light indicates that there are non-critical problems. A red light indicates that system limitations have been reached or there are serious errors.
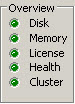
The overview shows this basic information for the following parameters:
-
License
-
Disk
-
Memory
-
Health
-
Cluster
-
Activity
License
The License frame shows the status of the Graphic Hub license.

The status shows license limitations or remaining number of days until the license expires. If your license expires, you receive instant chat messages with increasing frequency to that effect.
Disk
The Disk frame shows the status of the currently used partition where the data directory is located on the hard disk of the physical machine.
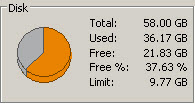
The status shows total, used, and free disk space, and also the warning limit. If the free disk space reaches this limit, you receive an Alerts to this effect. The warning is also logged in the Journal Panel. The warning limit is defined in the Preferences window.
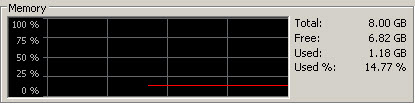
Memory
The Memory frame shows an overview of the physical memory of the server both in numeric values and over time.
Health
The Health frame shows various Graphic Hub status parameters.
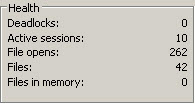
-
Deadlocks: Shows the number of deadlocks in the system. Any deadlocks necessitate the a restart of Graphic Hub.
-
Active sessions: Shows the number of current sessions.
-
File opens: Shows the total number of opened files.
-
Files: Shows the total number of files stored in the system.
-
Files in memory: Shows the number of currently open files. If it remains greater than 1 for an extended period of time, this may indicate locked files. In such cases, refer to the following procedures:
-
Open transactions: These are transactions that need to be deployed to the other server in the replication environment. If the number is too high, stop working until it is back to zero.
Cluster
If you are logged into both main and replication servers, you are presented with a Monitor Servers screen that reflects this.
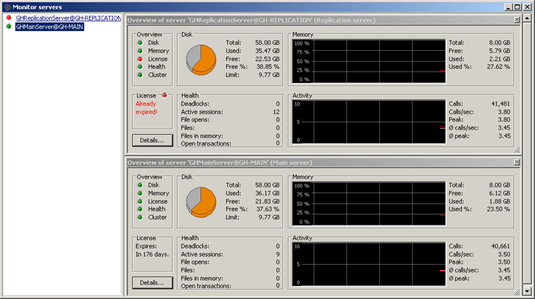
-
Title bar: Shows each server’s title bar shows its current status.
-
Cluster: Shows if the cluster is connected and healthy.
-
Open transactions: These are transactions that need to be deployed to the other server in the replication environment. If the number is too high, stop working until it is back to zero.
Activity
The Activity frame shows an overview of the server activity both in numeric values and over time.
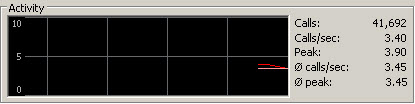
-
Calls: Shows the total number of calls made by any application to the Graphic Hub Server.
-
Calls/sec: Shows the average number of calls per second.
-
Peak: Shows the highest amount of calls during one second.
-
Ø calls/sec: Shows the average number of calls during one second for the total run time of the server.
-
Ø peak: Shows the highest amount of calls during one second for the total run time of the server.
Server Details
This window shows information about the folders and files stored in the Graphic Hub and loaded into the memory.
To View Server Details
-
In the Monitor servers window, click the Details button.
-
From the Refresh Rate drop down box it is possible to set the interval of when the information should be updated.
-
Selecting the Show Functions check box shows additional information used for debugging purposes.
Note: Only users with administrator rights can access this window.
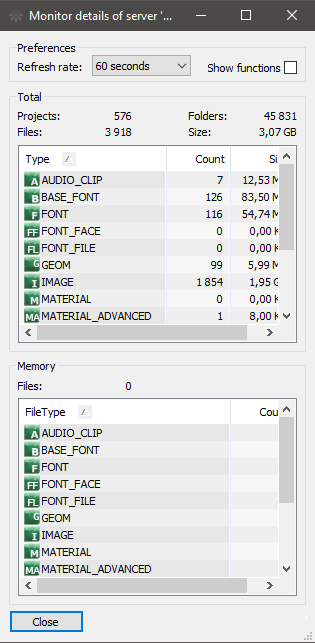
The Total frame shows the following information:
-
Projects: Shows the total number of projects in the Graphic Hub.
-
Folders: Shows the total number of folders in the Graphic Hub.
-
Files: Shows the total number of files in the Graphic Hub.
-
Size: Shows the amount of storage space used by the data.
-
Memory: The memory pane displays the currently open files, counted per type.
Warning and Error Thresholds
Certain conditions that may cause problems or lead to errors are signaled by the Graphic Hub when certain thresholds are crossed. An orange or red signal in the Overview indicates an issue that should be investigated by the administrator as soon as possible. In addition, the Graphic Hub provides a warning on shutdown, if one or more of the following conditions apply:
-
Less than 1,600 MB hard disk space is available.
-
More than 99 % physical memory is used.
-
Less than 100 MB virtual memory is available.
IMPORTANT! If less than 50 MB disk space is available, Graphic Hub does not allow any write operations, such as file create, truncate, or copy.
In the Overview, Warning level issues are indicated by an orange parameter light, and suggests that a restart is recommended. Critical level issues are indicated by a red parameter light, and suggests that a restart is necessary. Check the log files for further details. The following table lists the most critical limits and warnings:
|
Hardware Limit |
Mode |
Usage Limit, Journal Warning |
|
Less than 1,000 MB free disk space |
Localhost, 5/4 Free, Multiuser |
Critical disk space error. Only read access, no write operations permitted |
|
Less than 10,000 MB free disk space |
Main/Replication |
Critical disk space error. Only read access, no write operations permitted |
|
Less than 2 % free disk space or less than 5 % free disk space if 1 % of total disk space is less than 10,000 MB |
All |
Journal warning: Hard disk limit almost reached |
|
95 % or more physical memory used |
All |
Journal Warning: Suggests a restart is recommended |
|
100 % Physical memory used |
All |
Journal Fatal Error: Suggests a restart is necessary |
|
250 MB or less virtual memory available |
All |
Journal Warning: Suggests a restart is recommended |
|
100 MB or less virtual memory available |
All |
Journal Fatal Error: Suggests a restart is necessary |
In addition to the situations described in the above table, the following conditions produce a journal warning:
-
25 or more main/replication server switchbacks have occurred.
-
250,000 or more total open transactions have been processed.
-
7,500,000 or more critical calls have occurred (file created, truncated, written, replaced, copied, references changed).
-
9,000 or more total number of files (index information) in memory
-
48,000,000 or more total file opens.
-
2,000,000,000 or more total calls.
-
Main, folder, keyword or file index data file size exceeds 1,536 MB.
The following conditions produce a journal critical error:
-
30 or more main/replication server switchbacks have occurred
-
500,000 or more total open transactions have been processed
-
8,000,000 or more critical calls occurred (file created, truncated, written, replaced, copied, references changed).
-
10,000 or more total number of file (index information) in memory.
-
50,000,000 or more total file opens.
-
2,100,000,000 or more total calls.
-
A deadlock has been detected.
-
Main, folder, keyword or file index data file size exceeds 1,740 MB.
Server Properties
The Server Properties window shows the following types of information:
-
General server information.
-
Checksum information. To view Server Properties, right-click the server and select Properties from the Servers and Folders panel.
General Server Information
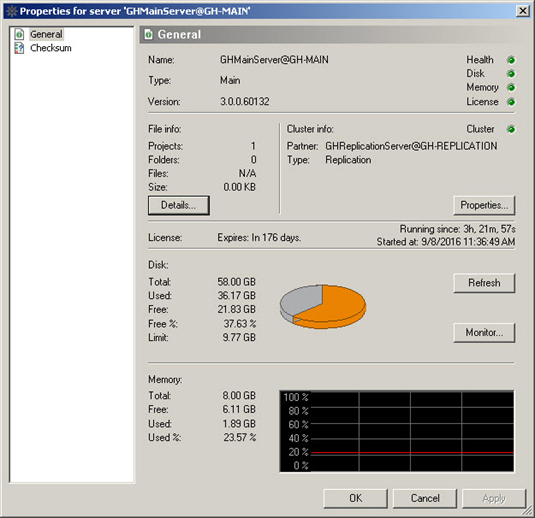
In addition to the server’s name, type and version, general server information includes:
-
License
-
Disk
-
Memory
-
Health
-
Server details
Checksum Information
View the checksum when you want to compare two or more Graphic Hub servers to see how identical they are. This is useful after having performed replication operations or when you have a real-time Deploy Agent. Empty servers have a checksum of 00.
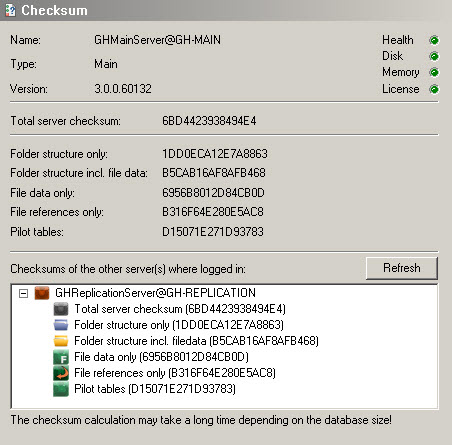
Use the Refresh button to update the checksum information for the servers currently logged on to. Checksum information includes:
-
Total server checksum
-
Folder structure (including file data)
-
File data only
-
File references only
-
Pilot tables
Empty servers have a checksum of 00. When logged on to more than one server, right-clicking in the checksum information window brings up the contextual menu, which gives access to:
-
Open differences...: Opens the Server Diff window. From this window, it is possible to detect differences between the servers (see Detect and Solve Server Differences).
-
Open differences and execute...: Opens the Server Diff window and executes the Diff all operation.
Note: Execution time of Diff all varies depending on the database size and the amount of differences between the servers being compared.
-
Open Pilot differences...: Opens the Pilot data differences window. See Resolve Viz Pilot Data Differences Between Graphic Hubs. This option only appears when connected to a server that contains Pilot data.
-
Properties: Opens the General server information window for the selected server.
Chat with Artists
Users can communicate with each other while logged in to Graphic Hub. This chat functionality is also used to receive global messages from Graphic Hub, such as information about a system shutdown. The messages that are sent and received are saved throughout the session. If your dongle expires or is otherwise invalid, you receive messages in the chat panel with increasing frequency until you renew it.
Tip: The chat feature is available from both Graphic Hub Manager and Viz Artist.
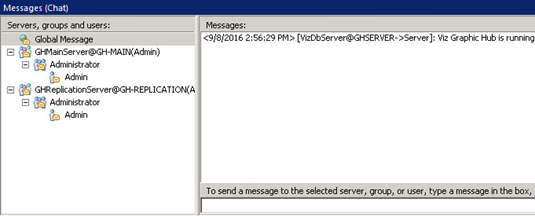
To Open the Chat Panel
-
Click View > Messages (Chat).
Note: If receiving a message while the Chat panel is hidden, the panel automatically opens.
To Send an Instant Message
-
Open the Chat panel.
-
Select the recipient from the left side of the panel.
-
Type a message text in the text box, and press ENTER. The message is sent to the selected Graphic Hub Manager and/or Viz Artist user(s).
Tip: Messages sent to Global Message are delivered to everyone. Messages sent to a group are delivered to every group member currently logged in.
Object Types
From this window you can view all the folders and file types on a selected server.
To View Objects
-
Click View > Object Types .
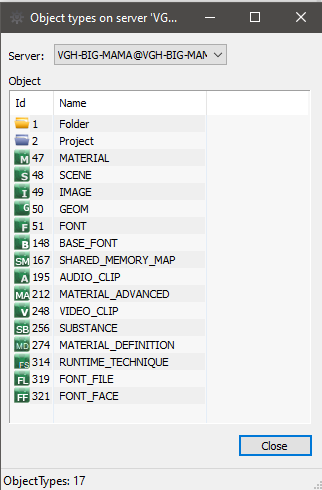
-
If logged in to more than one server, select which database to monitor from the Server list.
-
Each folder or file type is shown with its corresponding ID. Once an object is in the database, its type is added to the object types list. The type remains in the list even if all files of that type is deleted later on.