
DataPool User Guide
Version 2.13 | Published November 30, 2018 ©
Plugins
The DataPool plugins in Viz are responsible for handling incoming data and for affecting the objects in the scene according to the DataFields values.
Overview
The DataPool plugins are found in Viz in the Function plugins pool, under a folder called Data. There are DataPool Scene Plugins and DataPool Container Plugins. The scene plugins manage incoming data from different sources, inserting it to DataFields and maintain the DataFields Table. For example, the DataPool plugin receives information from external sources and inserts it to the different DataFields. The DataMouseSensor senses mouse position and events and stores them in predefined DataFields.
The container DataPool plugins trigger graphic changes in the container they are attached to, when the DataField registered to them changes. Most of the container plugins have an argument called Field Name. The field name value is the name of the DataField to which the plugin is registered to. The Field Name can take the following forms:
<name> <name>[number of items] If the field name is VALUE then the DataField is defined as a single datum field. However, if the field name is VALUE [100] then the name of the DataField is VALUE and it has 100 data items (values). The field name, scene hierarchy and the way the information is sent to the DataPool plugin determine the container plugin behavior.
Example
This is a hierarchy of a graph scene:
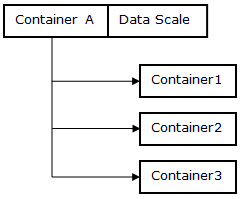
The above figure shows a container A with three children 1, 2, and 3. A DataScale plugin is attached to A. The DataScale plugin controls the scaling of the container according to the data it receives.
If the Field Name in the DataScale plugin is defined to be VALUES[3] (a vector of 3 items named VALUES), DataScale acts in two different ways:
-
If the data is entered without specifying an item index, DataScale affects container A.
Example: If the data is entered as VALUES=0.5 0.5 0.5; then the container A is scaled by 0.5 in each axis.
-
If the data specifies an item index, DataScale works on the respective child container of A.
Example: If the data is entered as VALUES[2] = 0.1 0.1 0.1;, then container3 is scaled by 0.1 in each axis (Note that the index value is zero based).