DataPool User Guide
Version 2.13 | Published November 30, 2018 ©
DataGraph
![]()
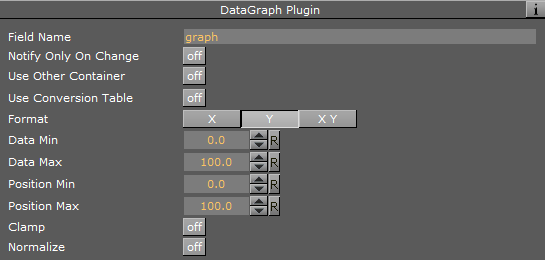
The DataGraph plugin works on the Graph geometry plugin in Viz. It enables controlling the values of the graph points. Incoming data value of the DataField must contain all the point values according to the selected format, separated by spaces.
Unique Parameters
-
Format: Defines the axis that is controlled by the plugin. If one axis is selected (X or Y) then the data should contain one value per point, if X Y is selected, then two values should be sent per point.
-
Normalize: Forces the graph points to use the entire height range (the range between Position Min and Position Max parameter) according to the minimum and maximum values received when set to On. The minimum value is used as the Data Min value and the maximum value is used as the Data Max, using the entire graph range for the received values.
Example
If format is set to X Y, then for drawing four point of the graph, eight numbers should be sent:
Abc=0 0 10 5 12 10 8 15;-
The first point is located at X=0, Y=0.
-
The second point is located at X=10, Y=5.
-
The third point is located at X=12, Y=10.
-
The fourth point is located at X=8, Y=15.