Viz Plug-ins User Guide
Version 5.0 | Published December 20, 2022 ©
Data Import

This plug-in enables Microsoft Excel (.xls and .xlsx) and Microsoft Access (.mdb) file import via ADO, and distributes it to a text field or a shared memory map. The plug-in supports reading both numbers and text.
To access Excel or Access data using this plug-in, you must first install the Microsoft Access Database Engine 2010 Redistributable .
Note: This plug-in is located in: Plugins -> Container plug-ins -> VisualDataTools
This page contains the following topics and procedures:
Data Import Properties
-
File: Chooses the required document.
-
Table / Sheet: Defines the name of the sheet or table.
-
Column(,Col...): Sets one or more column names to use (comma separated).
-
Area Input: Uses area information.
-
Column Input: Uses column information.
-
Row Input: Uses row information.
-
Data Delim.: Includes delimiter after each row.
-
Column Delim.: Includes delimiter for column separator sign(s).
-
Shared Mem.: Sets Scene-, Global- or Distributed-Shared Memory for data transport. Use Inactive memory to not forward any values via Shared Memory.
-
Key: Determines Shared Memory key name.
-
GetIt: Reads the document, sends the required data and shows it in the text box.
To Create a Scene with Data Import
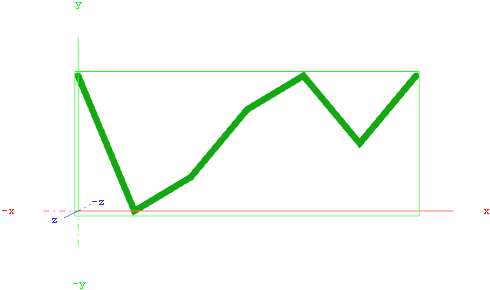
This procedure imports data from an Microsoft Excel sheet and feed the Line Chart plug-in with data through Shared Memory.
-
Start Microsoft Excel.
-
Enter ExcelDataY into cell A1.
-
Add some sample values in the cells below (A2-A8: 80,40,50,70,80,60,80).
-
Rename this first sheet to MyTable (can be done with a double click on the sheet name at the bottom).
-
Save and close the Excel document.
IMPORTANT! You must close the document before importing it to Viz Artist.
-
Start Viz Artist and create a new scene.

-
Add a group container to the scene tree.
-
Drag and drop the Line Chart and Data Import plug-in to the group container.
-
Add a material to the same group container.
-
Open the Transformation Editor and set Position X to -200.0 and Position Y to -100.0.
-
Set Shared Mem. to Scene with MyDataY as Key name for both plug-ins.
-
Set Data Delim. to # for both plug-ins.
-
For the Line Chart plug-in set ChartWidth to 500.0.
-
Activate DataY Fit, DataY Auto Scale and DataY Detect Limits.
-
Adjust DataY Stop to 200.0.
-
Activate Const. Thickness to give the chart a constant line width.
-
For the Data Import plug-in, set the stored Excel file as the File parameter.
-
Enter MyTable for the Table/Sheet parameter and ExcelDataY for Column (,Col…).
-
Click the GetIt button and the chart shows.