
Viz Engine Administrator Guide
Version 5.1 | Published November 09, 2023 ©
Performance
Analyzing the performance of Viz Artist/ Viz Engine can be done with two tools:
-
Performance Monitor: Closely monitors a range of parameters for analyzing real-time performance.
-
Performance Analyzer: Monitors key performance and camera parameters, as a head-up display in the renderer window.
Performance Monitor
To open the Performance monitor click on the  toolbar button.
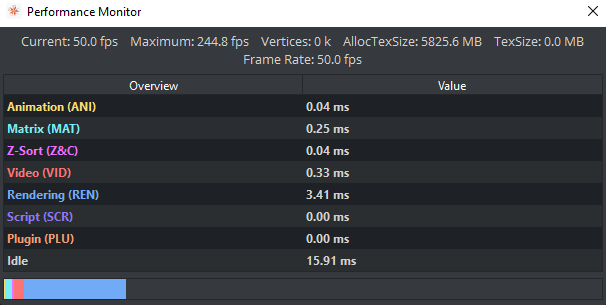
The performance bar gives an idea of the current scene rendering performance (frames per second).
-
Current (CUR): Shows how many frames per second the scene renders in On Air mode. The number should be above 50 (PAL) or 60 (NTSC), according to the rate that has been specified in the Output Format section of the Viz Engine Administrator Guide.
-
Maximum (MAX): Shows how many frames per second the scene can render at without waiting for vertical retrace. The higher the maximum value, the more performance is left. If the maximum value is reduced to below 50 or 60, the scene is not rendering in real-time.
-
Vertices (VER): Shows the number of vectors in the scene.
-
AllocTexSize (TET): Shows the total allocated size of texture memory.
-
TexSize (TEC): Shows the size of the currently used texture memory.
-
Animation (ANI): Shows how many microseconds all active directors and animation channels take. This indicator is linked to the yellow bar.
-
Matrix (MAT): Transforms each container in the scene into world coordinate space. This indicator is linked to the cyan bar.
-
Z-Sort (Z&C): Refers to Z-sort and Culling, and sorts all containers for correct transparency drawing and determines if containers are visible in the current camera view. This indicator is linked to the pink bar.
-
Video (VID): Shows how many microseconds video input (live video texture) and video output take. De-interlaced video inputs take longer time than progressive and interlaced. The only way to improve this value is to use a faster system. This indicator is linked to the red bar.
-
Rendering (REN): Shows how many microseconds it takes to render all objects on the screen. A faster graphics card improves this value. This indicator is linked to the blue bar.
-
Script (SCR): Shows the consumed time in microseconds from all active scripts. This indicator is linked to the dark green bar.
-
Plugin (PLU): Indicates how much time in microseconds all active plug-ins spend in each render cycle. This indicator is linked to the orange bar.
-
Idle: Shows available resources in microseconds the renderer has available. This indicator is linked to the light green bar.
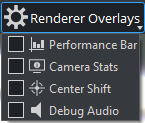
Renderer Overlays
To select which performance data to show in the renderer window, click on the Render Overlays tool button then select the options to show:
-
Performance Bar: Shows the a detailed Performance analyzer.
-
Camera Stats: Enables the head-up display (HUD) showing the following parameters in the renderer view:
-
Camera 1-n: Shows the currently selected camera.
-
Position: Shows the camera’s X, Y and Z position.
-
Pan/Tilt/Twist: Shows the camera’s pan, tilt and twist parameters.
-
FovX/FovY: Shows the camera’s field of view (FOV) for the horizontal (X) and vertical (Y) plane.
-
Center Shift: Shows the X and Y position of the camera’s center shift.
-
-
Center Shift: Shows the center shift marker as a cross hair in the renderer.
-
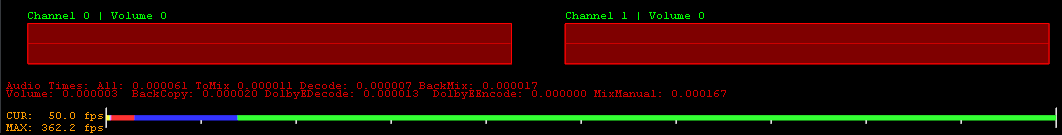
Debug Audio: Turns on/off a visual representation of the audio mixing.
Performance Bar (Classic)
The performance bar gives an idea of the current scene rendering performance (frames per second).
The values shown are the same as described in the Performance Monitor section above.
Performance Bar and Analyzer (Viz Engine Render Pipeline)
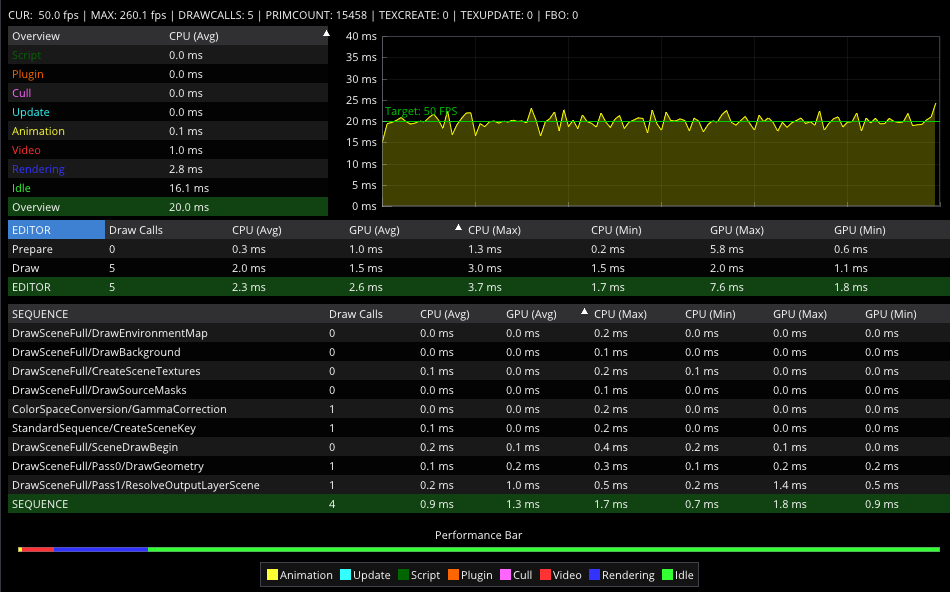
The Viz Engine Render Pipeline shows more detailed information about:
-
Current and Maximium Framerate.
-
Segmented render time and historic data.
-
Timing information for all used Sequence pipelines.
-
Performance Bar.