Vizrt 2110 I/O Module User Guide
Version 1.1 | Published May 18, 2021 ©
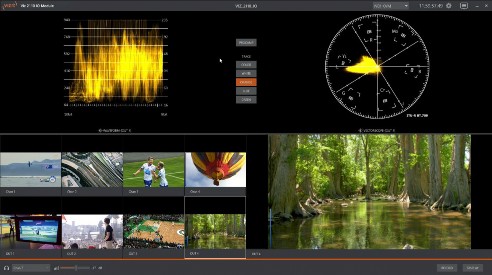
Titlebar and Dashboard
Viz 2110 I/O’s Titlebar and Dashboard are home to a number of important displays, tools and controls. Prominently located at the top and bottom of the Desktop, the Dashboard occupies the full width of the screen.
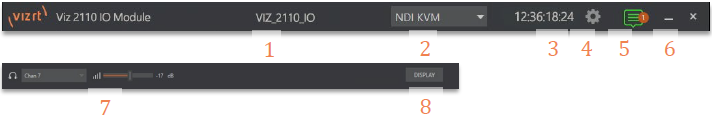
The various elements presented in these two bars are listed below (starting from the left):
-
Machine name (the system network name supplies the prefix identifying NDI output channels)
-
NDI KVM menu: Options to control Viz 2110 I/O remotely via NDI connection
-
Time Display
-
Configuration
-
Notifications Panel
-
Minimize and Exit
-
Headphones Source and Volume
-
Display
Of these items, some are so important that they rate their own chapters. Others are detailed in various sections of this guide (cross references to the relevant sections of the manual are provided above).
Titlebar Tools
NDI KVM
Thanks to NDI®, it is no longer necessary to configure complicated hardware KVM installations to enjoy remote control over your Viz 2110 I/O system. The free NDI Studio Monitor application for brings network KVM connectivity to any Windows® system on the same network.
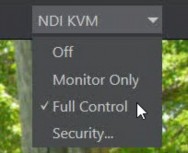
To enable NDI KVM, use the titlebar NDI KVM menu to select an operating mode, choosing between Monitor Only or Full Control (which passes mouse and keyboard operations to the remote system). The Security option lets you apply NDI Group control to limit who can view the NDI KVM output from the host system.
To view the output from the remote system and control it, select your Viz 2110 I/O IP system’s Device Name]>User Interface in the Studio Monitor application supplied with the free NDI Tool pack, and enable the KVM button overlaid at upper-left when you move the mouse over the screen.
Tip: Note that Studio Monitor’s KVM toggle button can be relocated to a more convenient spot by dragging.
This feature gives you a great way to control the system around your studio or campus. With the User Interface running full screen in Studio Monitor on a receiving system, it’s really hard to remember that you’re actually controlling a remote system.
Even touch is supported, meaning you can run the User Interface output on a Microsoft Surface™ system for portable touch control over your entire live production system (many of the interface screengrabs shown in this manual, including those in this section, were grabbed from NDI Studio Monitor while controlling the remote system in the manner described above).
System Configuration
The System Configuration dialog is opened by clicking the ‘gear’ gadget next to the Titlebar time display and appears as shown in Figure 23.
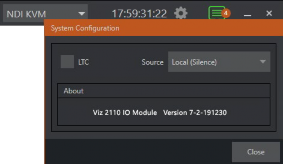
LTC Timecode
LTC timecode support can be activated by choosing an input using the LTC > Source menu to choose almost any audio input to provide the timecode signal and enabling the checkbox at left.
About
The About box displays the current software version and hardware revision of the unit.
Notifications
The Notifications panel opens when you click the text balloon gadget at right in the Titlebar. This panel lists information messages the system provides, including any cautionary alerts.
Tip: You can clear individual entries using by right-clicking to show the item’s context menu, or the Clear All button in the panel’s footer.
Viewport Tools
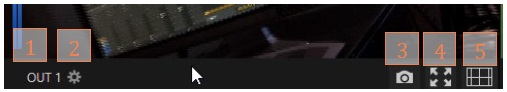
SDI I/O’s channels each have a toolbar beneath their respective viewports. The various elements comprising the toolbar are listed below from left to right:
-
Channel name: Can be changed by clicking on the label, and also in the Configure Channel panel.
-
A Configuration gadget (gear) pops up next to the channel name when the mouse is over a viewport.
-
-
Record and Record Time: The record button below each viewport toggled recording that channel; the RECORD button in the bottom dashboard opens a widget enabling capture from any SDI input.
-
Grab: The base filename and path for still image grabs are set in the Configure Channel panel.
-
Full screen
-
Overlays
Grab
![]()
A Grab Input tool is located in the lower right corner below the monitor for each channel. By default, still image files are stored in the system Pictures folder. The path can be modified in the Output window for the channel (see the Output heading above).
Fullscreen
![]()
Clicking this button expands the video display for the selected channel to fill your monitor. Press ESC on your keyboard or click the mouse to return to the standard display.
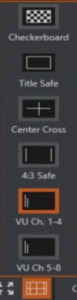
Overlay
![]()
Found in the lower right corner of each channel, Overlays can be useful for visualizing safe zones, centering and more. To use an overlay, just click on an icon in the list. More than one overlay can be active at the same time.
Dashboard Tools
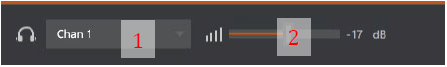
Audio (Headphones)
You can connect a headset to the (green) audio output jack on the rear of SDI I/O’s motherboard. Controls for Headphone audio are found in the lower-left corner of the dashboard at the bottom of the screen.
-
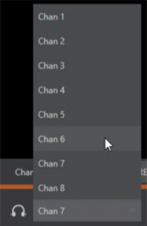
The audio source supplied to the Headphone jack can be selected using the menu next to the headphone icon.
-
The Volume for the selected source can be adjusted moving the slider provided at right (double-click this control to reset it to the default 0dB value).
Record
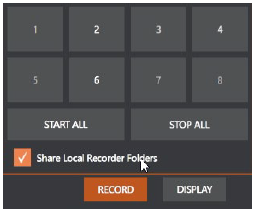
The Record button is also located in the lower-right corner of the dashboard. Click it to open a widget allowing you to begin or stop recording of individual channels (or start/stop all recordings).
Note: The destinations for recorded clips, their base file names and other settings are controlled in the Configuration panel (see Figure 2-8). Recording NDI sources is not supported. The Share Local Recorder Folders can be used to expose local folders assigned to capture duties on your network, making it easy to access captured files externally.
Display
In the bottom-right corner of the Dashboard at the bottom of the (primary) screen, the Display widget offers a variety of layout options to let you viewing channels individually or in groups, as well letting you configure a second monitor.
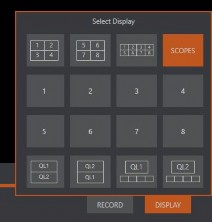
Waveform and Vectorscope features are shown when you select the SCOPES option in the Display widget.