Viz Arc Script Guide
Version 1.7 | Published November 15, 2022 ©
Debugging
DevTools
You can use any chrome based web browser (for example, Google Chrome or Microsoft Edge) to step through Viz Arc scripts.
-
Open your browser.
-
Enter chrome://inspect/ in the address bar.
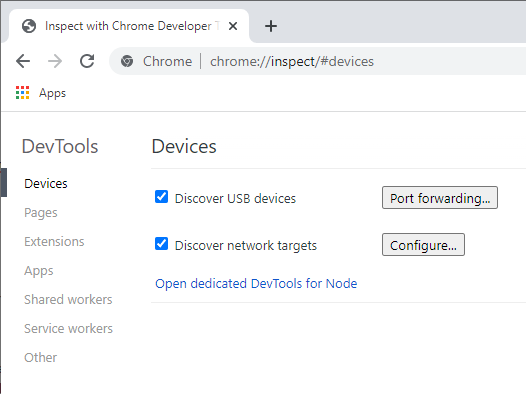
-
Click Configure...
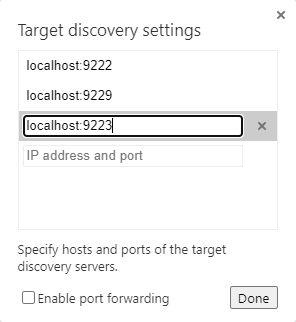
Add the host name where Viz Arc is running and specify the debug script port (by default, port 9222 for the global script and port 9223 for the template builder script). Confirm by clicking the Done button. -
Open a template in Viz Arc's template builder and start it.
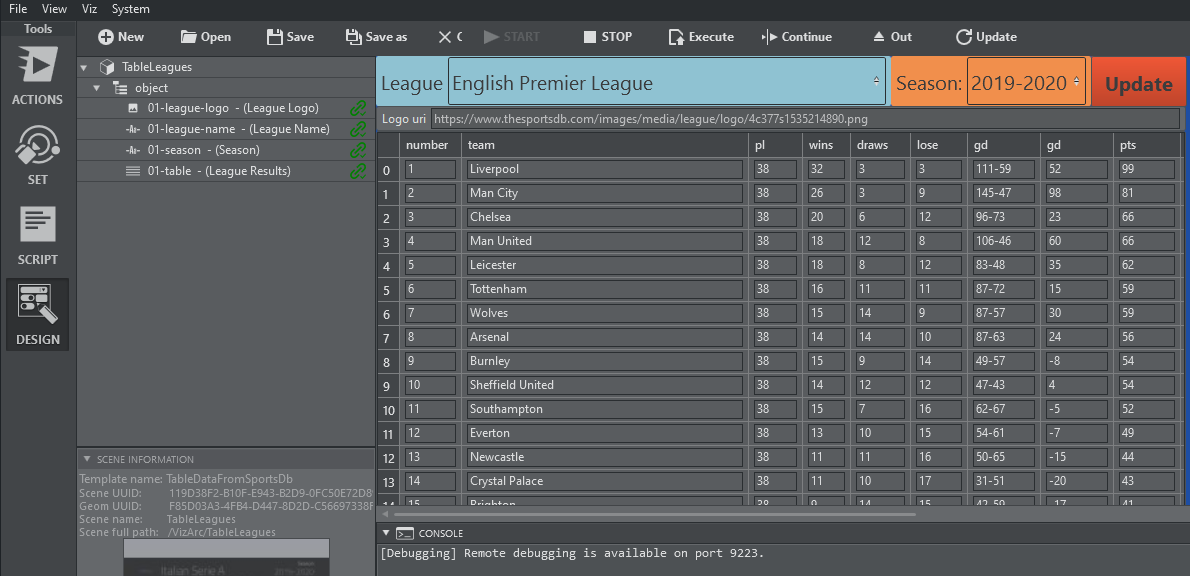
-
In the Chrome browser, you should now see the Viz Arc script available for debugging.
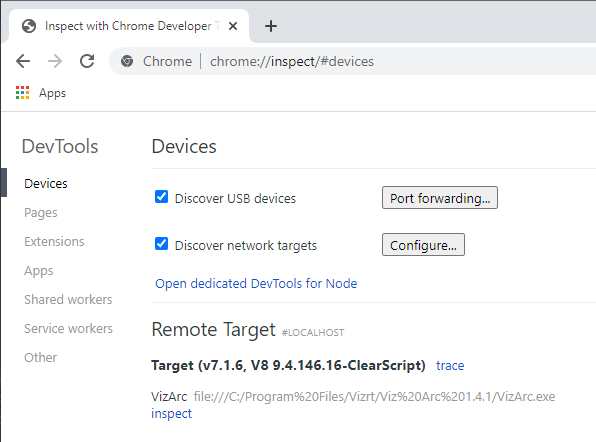
-
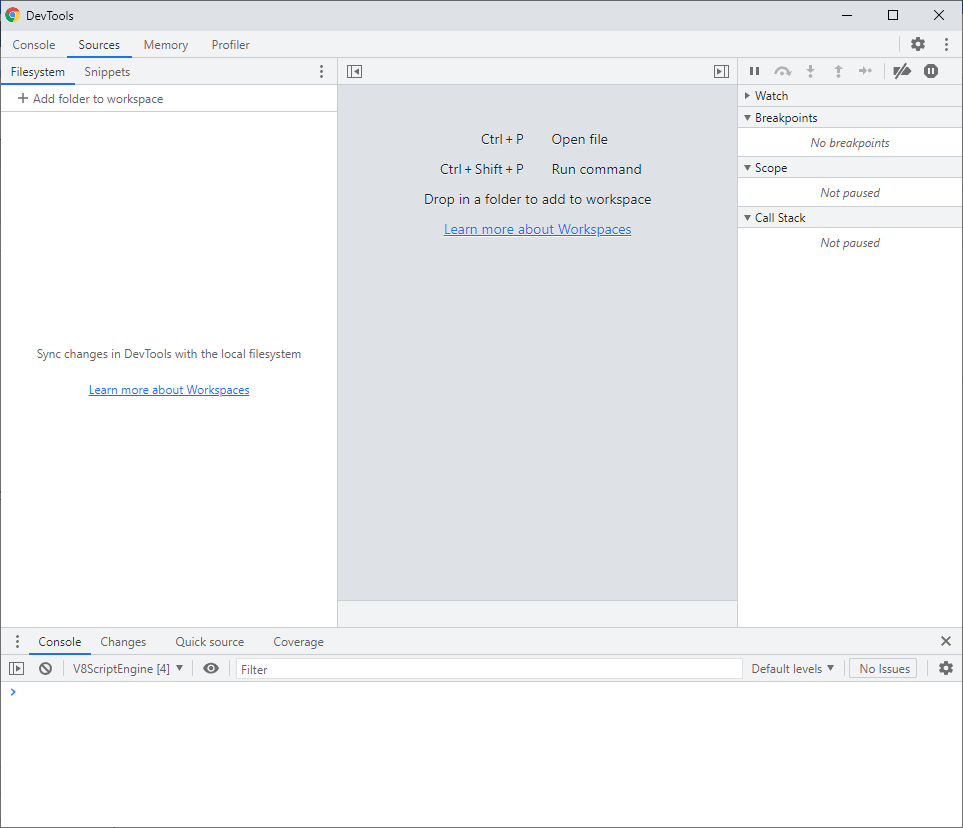
Click the inspect link to open the debugger. The first time you open the debugger it does not show any code.
Hit CTRL + P and select Module.
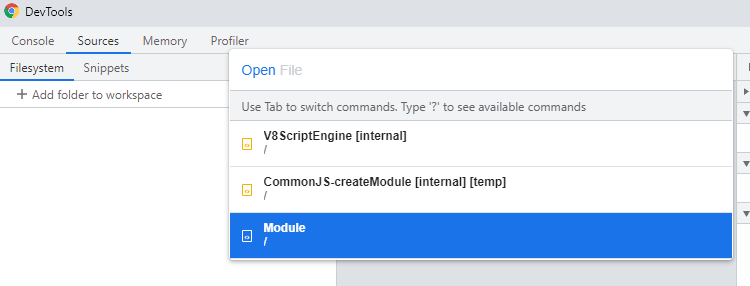
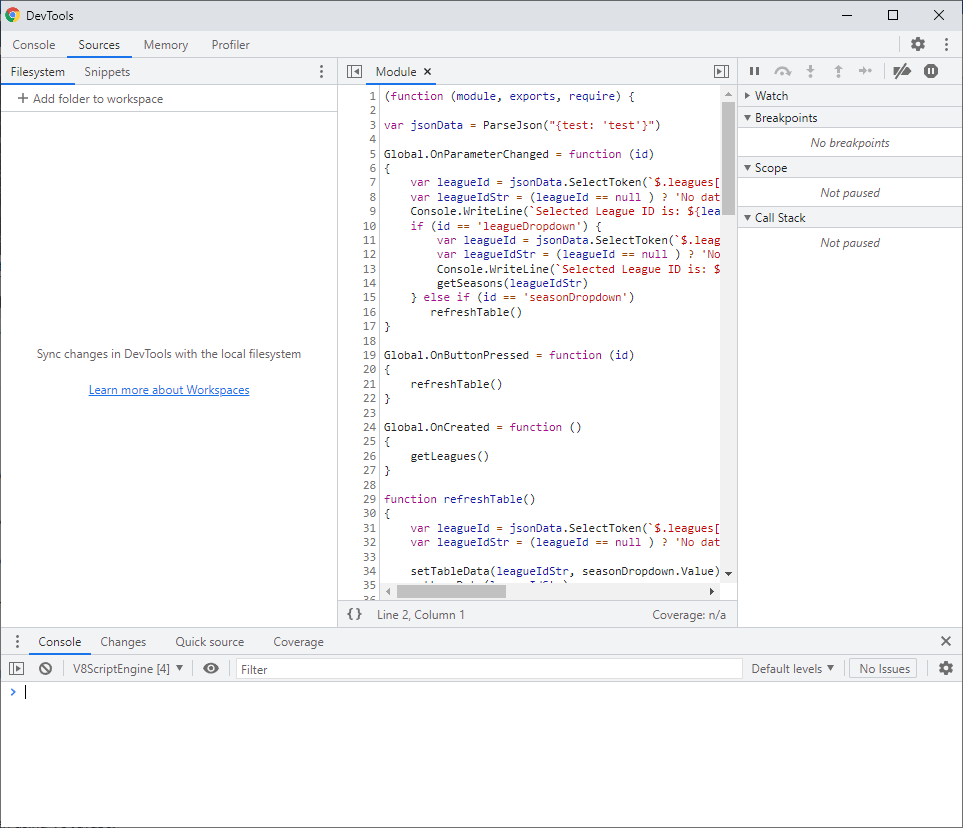
You'll now be able to set breakpoints and see the code.
-
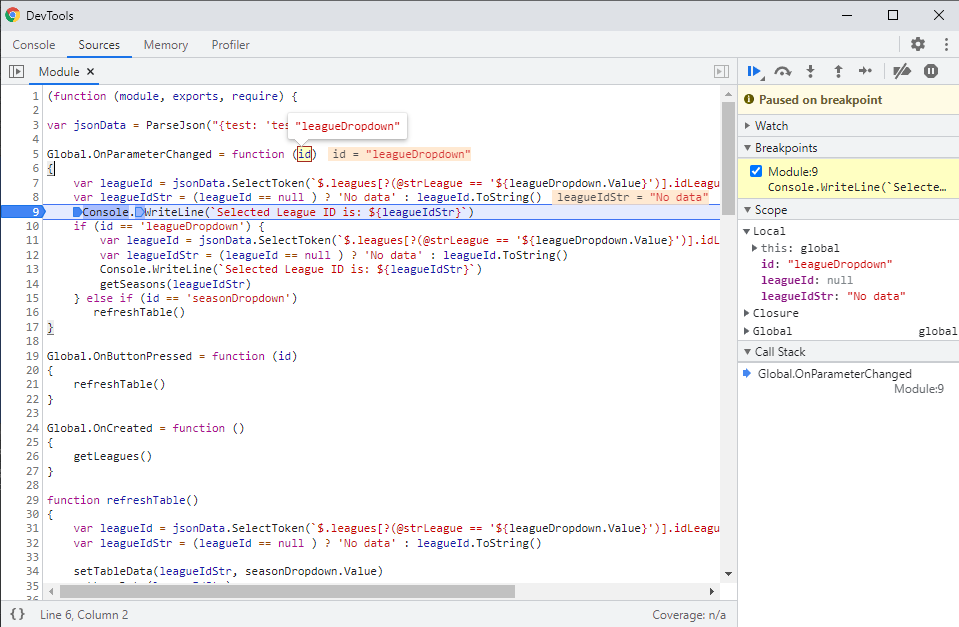
Set a breakpoint and analyze your variables and code.
Visual Studio Code
You can debug scripts with Visual Studio Code when using V8 JavaScript in the global script or in any scripted template.
-
Install and launch Visual Studio Code.
-
Set up one or more Viz Arc V8 debug configurations:
-
Click File > Preferences > Settings to open your user settings.
-
Locate or search for the Launch configuration and click Edit in settings.json.
-
Add the following section to the file:
{"debug.javascript.usePreview":false,"launch": {"version":"1.2.0","configurations": [{"name":"Attach to Viz Arc Global Script on port 9222","type":"node","request":"attach","protocol":"inspector","address":"localhost","port":9222},{"name":"Attach to Viz Arc Template Scrip on port 9223","type":"node","request":"attach","protocol":"inspector","address":"localhost","port":9223}]}} -
You can specify additional configurations for different hosts, port numbers, and other options. See Node.js debugging in VS Code for more information.
-
Click File > Save.
-
-
If you’d like to debug your application remotely, you must also make sure that your firewall allows incoming connections to your TCP port.
-
Attach the Visual Studio Code debugger to your application:
-
Click View > Debug to bring up the Debug view.
-
Select the appropriate debug configuration at the top of the Debug Side Bar.
-
Click Debug > Start Debugging.
-
Note: There are two different ports in use: One for the global script (default 9222) and one for template scripts (default 9223). Template scripts can be debugged only when running in the designer. The ports can be configured in the global configuration settings.
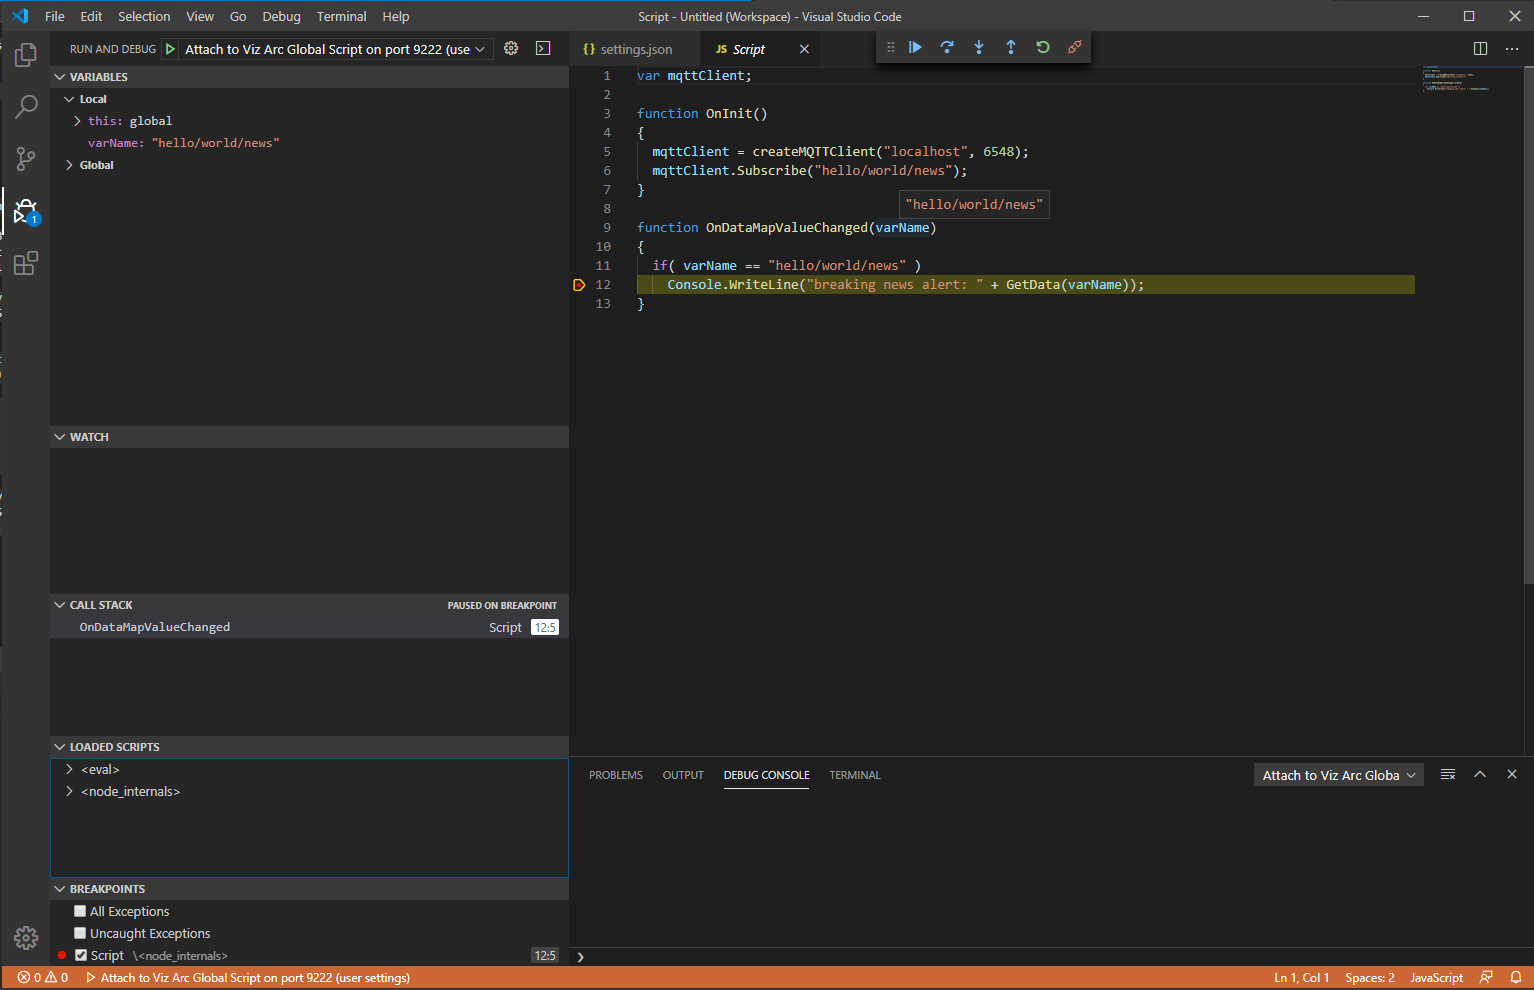
The screenshot above shows a global script being stopped at a breakpoint.
See Also