Analyze Time
Analyze Time - a visual representation of the tracking.
To Analyze Tracking System Time
-
Right-click on the Tracking System that is to be analyzed and select Analyze Timing.
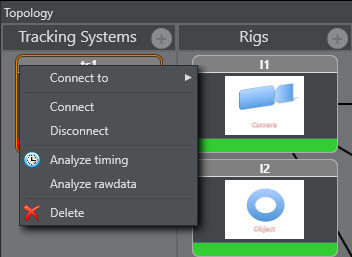
This adds a new element to the Services panel, called TrackingTiming.
-
Click on the TrackingTiming Service element. In the Properties panel, make sure that:
-
The IP of the local PC is inserted, and
-
The service is set to Active.
-
To Analyze a Service Time
-
Right-click on the Service System that is to be analyzed and select Analyze Time.
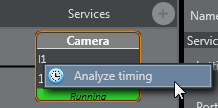
This adds a new element to the Services panel, called TrackingTiming.
-
Click on the TrackingTiming Service element. In the Properties panel, make sure that:
-
Make sure the IP of the local PC is inserted, and
-
The service is set to Active.
-
To View Timing Information
-
In the Configuration Panel, click the View Timing Analysis button
 .
.
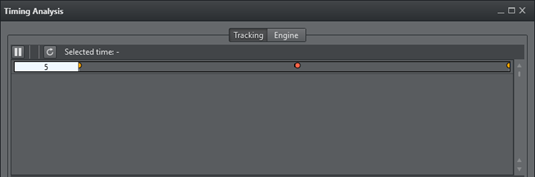
In a Timing panel with a correct data stream:
-
Purple line: Shows the time when the Tracking Hub has inserted a data package from the tracking system into the data pool
-
Green line: Shows the time when the communication part of the Tracking Hub starts to read from the data pool
-
Red Dot: Indicates data sent to a Viz Engine has stopped
Upper Section
In the upper section, the first line is the timing of live tracking data.
These timestamps are shown:
Sync:
-
Start RX: Start time, when data is received from the tracking system
-
End RX: End time, when data stops from the tracking system
-
Start Ins: Start time, when Tracking Hub inserts received data into the parameter pool
-
End Ins: End time, when Tracking Hub has finalized inserting data
Orange Dot: Sync Timestamp
Blue: The time between Start RX and End RX
Note: The time between Start RX and End RX can be very short and thus almost invisible if a network communication is in use.
Purple Line: The time between Start Ins and End Ins
Line 2: Shows when the live tracking data is processed and sent to the Viz Engine.
-
Start Calc: The start time. When tracking data is calculated and prepared for a Viz Engine, this time is defined from send delay. After this delay has passed the Tracking Hub starts with this procedure for calculation and sending data
-
End Calc: The end time. When tracking data preparation is finished
-
End Send: Time when data has been send to the Viz Engine
Green Line: Time between Start Calc and End Calc
Red Dot: End Send Timestamp
Lower Section
The lower part shows the last ten second history of the timing. Three timestamps are shown.
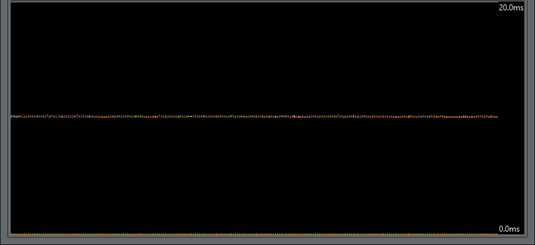
Note: Only three timestamps are shown to make the recognition of the timing behavior easier.
-
End Ins: As time, when receiving is finished (purple (1))
-
Start Calc: When data processing starts (green (2))
-
End Send: When Tracking Hub work is finished for this field (red (3))
To get the optimal timing, the Start Calc time must be later than the End Ins time, for every field. To achieve this, the send delay has to be adjusted correctly.
The white line shows the delay. This line should be the absolute border between End Ins (purple line) and Start Calc (green line). To change the delay, use drag and drop to move the white line.
If the delay can not be adjusted correctly, this can be for several reasons, for example, tracking data is received too late.
Note: This is not too bad, but keep in mind, that this result is in a tracking delay of one field.
This doesn't matter so much, because in normal production you need more the one field tracking delay.