The Data Fit plug-in listens for incoming data and modifies and redistributes it to another Shared Memory key.
Note: This plug-in is located in: Plugins -> Container plug-ins -> VisualDataTools
This page contains the following topics and procedures:
Data Fit Properties
Shared Mem: Changes between Scene-, Global- and Distributed-Shared Memory. Use Inactive memory to not forward any values via Shared Memory.
Transfer Mode: Sets string- or array-based data transfer.
Data Delim. Src.: Defines the value separator sign(s) for all data sources.
Data Delim. Dest.: Defines the value separator sign(s) for all data destinations.
Key Data Src.1-5: Shared Memory key name for input 1-5.
Key Data Dest.1-5: Shared Memory key name for output 1-5.
Scale: Scales each incoming value by that factor.
Offset: Adds an Offset to each incoming value.
Autoscale: Activates automatic scaling mode. Now all data is scaled to a certain range defined by the following two parameters:
Start: Determines autoscale starting range.
Stop: Determines autoscale stopping range.
To Create a Scene with Data Fit
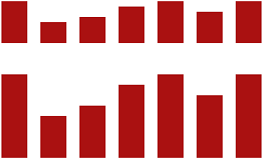
This procedure feeds two charts with data. One with the original and the other with the modified data from Data Fit.
Create a new container.
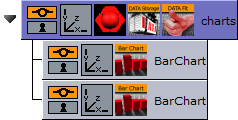
Drag and drop a Data Storage and a Data Fit plug-in into this container.
Drag and drop two Bar Chart plug-ins to become children of this container.
Open the first Bar Chart editor and set Shared Mem. to Scene and KeyData to
MyData.Do the same for the second Bar Chart but use MyDataFit as the key name.
Go to the Data Fit plug-in and set its Shared Mem. type also to Scene
Set Key Data Src.1 to MyData and Key Data Dest.1 to MyDataFit > set Scale to
2.0. The input Shared Mem key is specified with Key Data Src. and the output with Key Data Dest.Now edit Data Storage for the input values: set Shared Mem. to Scene, Key Data1 to MyData and type in some example values for Data1:
80,40,50,70,80,60,80. As soon as you start typing you see both charts building up with the different values from Data Fit.


