Datacenter User Guide
Version 2.1 | Published April 03, 2024 ©
Overview
Accessing Datacenter
Datacenter runs automatically as a service on the host machine. It automatically starts on Windows startup, and its status can be monitored in Task Manager → Services → VizrtDataCenter.
While the service is always running in the background, the main user interface can be opened using a browser on the same machine hosting the service, using one of the following addresses:
-
http://127.0.0.1:5700. This address is always available, regardless of the service mode being configured (see HTTPS Certificate configuration).
-
https://127.0.0.1:5701. This address is only available if a valid HTTPS certificate has been configured (see HTTPS Certificate configuration).
If Datacenter is correctly configured to run an HTTPS backend that listens to all network interfaces, then the user interface is also reachable from:
-
https://<host-machine-ip>:5701, where <host-machine-ip> is the public IP of the host machine. This mode allows you to reach and monitor Datacenter from all machines in the same network, for example.
Info: The Admin page is only accessible when the Datacenter user interface is reached using the localhost address option.
Datacenter Main Entities
Datacenter connects data Providers to application Outputs, organizing the data flow into separate and editable Datasets. Specifically:
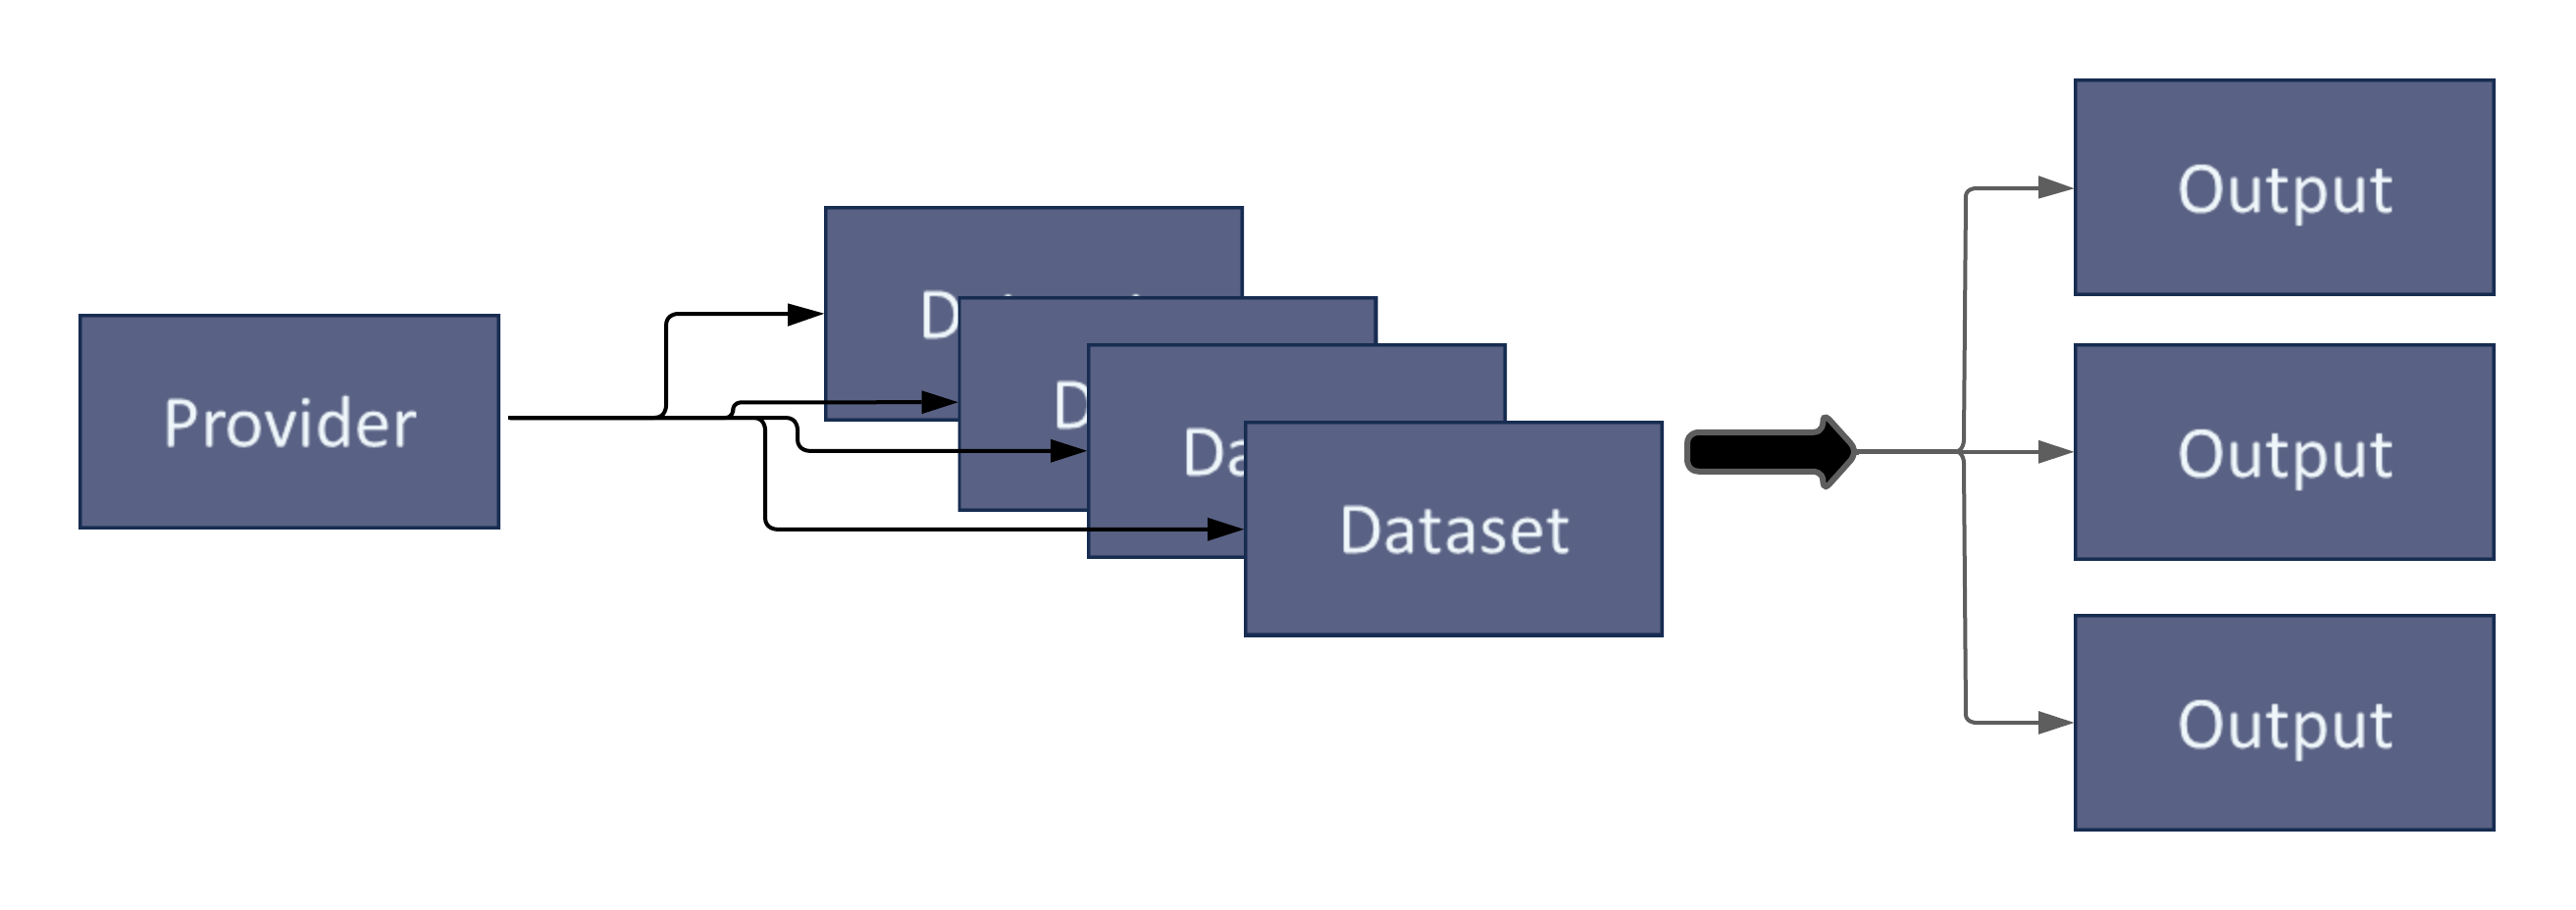
-
A data Provider represents a data source to which Datacenter connects to. It can be a local (for example, a file) or a remote resource (for example, a server), and its unique (there is only one Provider of type File).
-
A Dataset represents a collection of data entries from a specific Provider. It is created by the user, and there is no limit to the number of datasets of a specific provider that can exist. Each dataset holds one or more data entries, all coming from the same provider resource.
-
An Output represents the sending end of the Datacenter data flow. There exists a finite number of output types (for example, Viz Engine or Viz Arc), but there is no limit to the number of instances.
The Datacenter Main Page
The Datacenter main user interface consists of six sections:
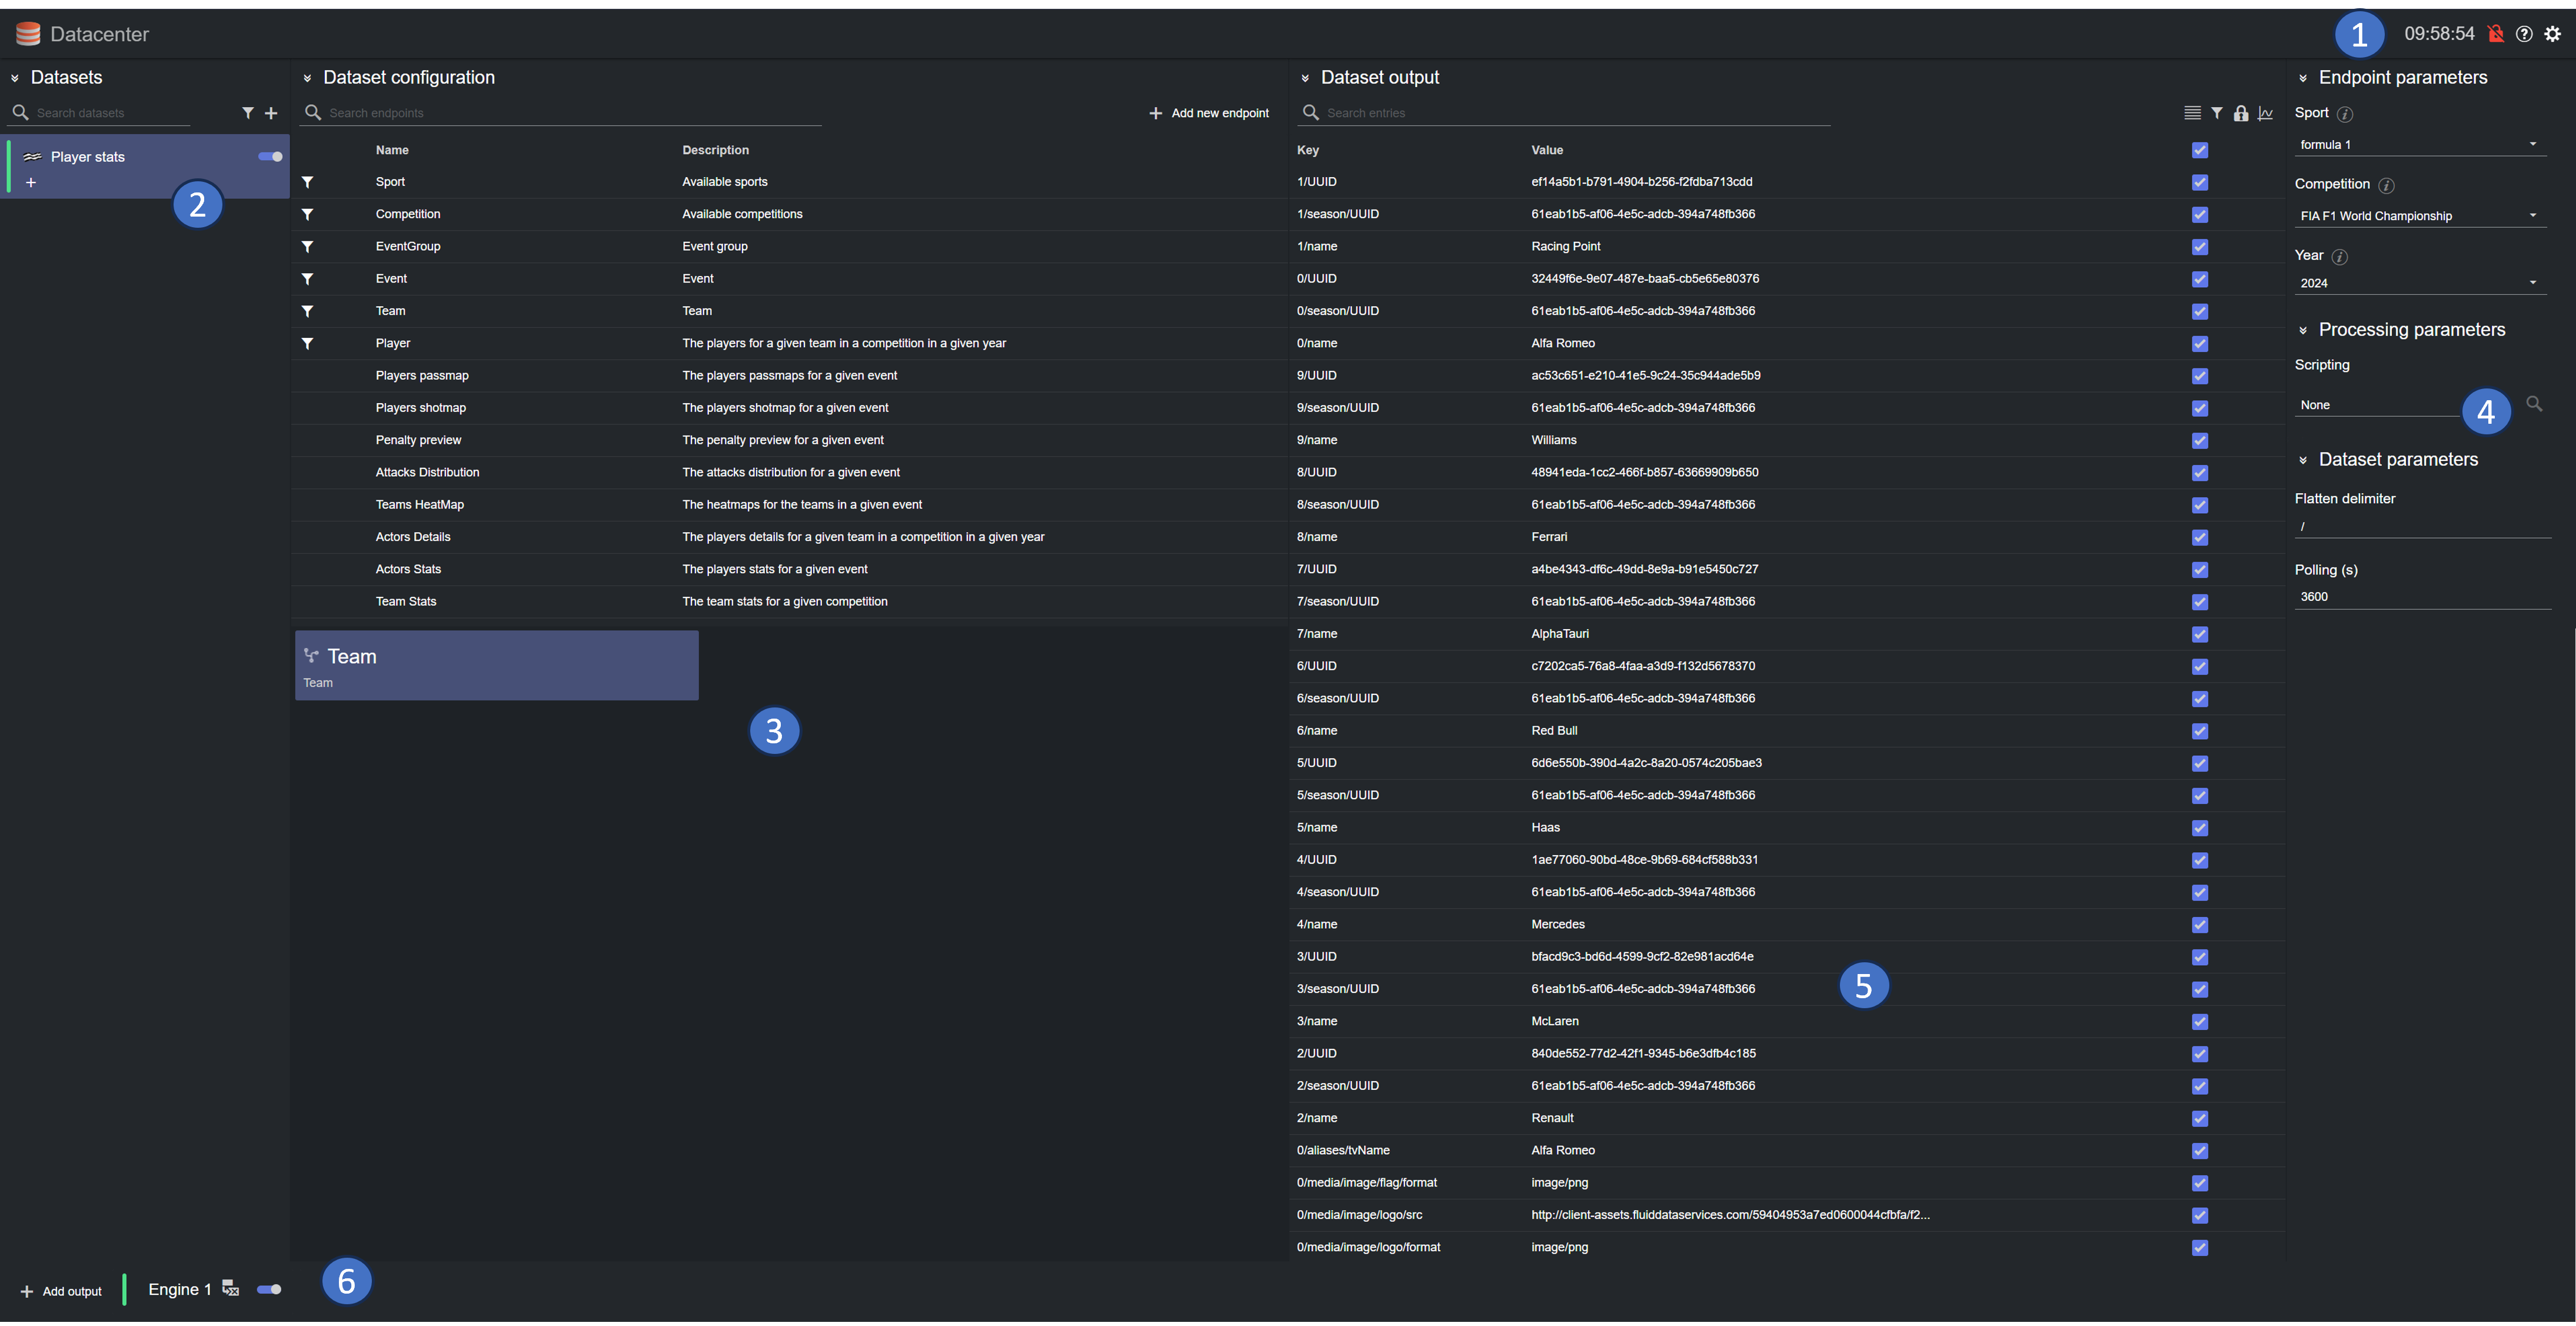
-
Application Bar: Use this section to navigate between the Main and Admin page, check the status of the service, as well as the service HTTP(s) mode. Documentation can also be opened from the status bar.
-
Datasets pane: Where all the configured datasets are listed. A dataset can be selected with its status shown on the status line on the left, and toggled off from here. Its entry can also be cloned to create a second independent dataset.
-
Dataset Configuration pane: In the configuration pane a new dataset can be configured or an existing one edited. Specifically, a dataset source or a provider specific element can be selected in the configuration pane and edited in the Settings Editor. This view changes according to the Provider being used.
-
Settings Editor: Edit specific provider elements or a dataset source parameters (for example, endpoint parameters or refresh rate for a source). This view is dynamic and adapts according to the Provider being used and the element being selected in the Dataset Configuration pane.
-
Dataset Output pane: In this section, the key and value pairs that belong to the currently selected dataset are shown. These values are available in the configured output, they can be toggled, flattened or merged, and in the case of Manual Provider, values can be edited or keys added/removed.
-
Viz Outputs footer: The configured outputs for the incoming data are configured and listed here. Click on an output name to open the edit dialog, the output status is shown on the status line on the left, while the toggle can switch an output ON/OFF.