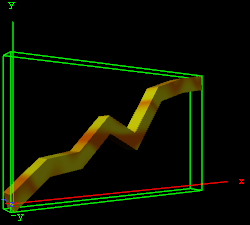
The Graph plug-in allows you to create a 2D or 3D graph with up to 50 values.
Note: This plug-in is located in: Plugins -> Geom plug-ins -> Default
Graph Properties
Use LOD: Enables/disables dynamic level of detail.
Width: Sets the width of the graph.
Height: Sets the height of the graph.
Start: Sets the starting point of the graph.
End: Sets the ending point of the graph.
Line Width: Defines the line width.
1st/last segment interpolation: Switches the interpolation of the first and last segment on or off.
3D: Enables/disables 3D visualization of the graph.
Extrusion depth: Sets the graph’s extrusion depth.
Add backside: Enables/disables visualization of the graph backside.
Use vertex color: Enables a base color for the graph. Set the values in the color editor or drag a material onto the small square below the parameter.
Line color: Enables the use of a vertex color.
X0/Y0 to X49/Y49: Enables up to 50 different value points of the graph by giving coordinates on the X- and Y-axis.
To Create a Graph
Create a new group and add the graph plug-in to it.
Add a material and/or a texture to the group, or open the graph editor and enable Use Vertexcolor and set the Line Color.
Open the graph editor and set the Start and End points.
Enable 3D and set Extrusion Depth to
30.0.Add points for the X- and Y-directions (i.e. X0/Y0, X1/Y1 and so on).

